.png)
Edmonton’s Housing Market Heats Up in March 2025
The Edmonton real estate market has shown growth in new listings and sales volume compared to the previous month. The average price of single-family detached homes has increased by 5.6% month-over-month. Buyers faced a competitive market, with homes selling in a median of 17 days and 32.8% selling above the list price.
New Listings Insights
The number of new homes listed in Edmonton for 2025-03 was 2,864, representing a gain of 40.4% from the previous month.
The 12-month trend line indicates a gradual increase in listing volume over the past year.
March 2025 saw the strongest monthly growth in new listings in recent months.
Want to know all the costs associated with selling your home? Learn more in our article: How Much Does It Cost to Sell Your House in Alberta?

Sales Activity
The sales activity remained strong with 1,754 homes sold in March 2025. The average house price in Edmonton also went up both month-over-month (MoM) and year-over-year (YoY). Increased sales volume and shorter average time to sell a house are typical characteristics of a spring market in Edmonton.
Sales Activity Insights
Total homes sold in 2025-03 was 1,754, a gain of 36.6% from the previous month.
Year-over-year, sales volume has changed by -6.1% compared to the same month last year.
The sales trend over the past 12 months shows challenging buyer conditions.


Edmonton Home Prices: What You Need to Know
Over the past 12 months, new listing volume have gradually declined, accompanied with the declining interest rates has intensified competition among buyers. This dynamic, combined with population growth and strong employment numbers, has contributed to rising home prices in Edmonton.
Price Analysis Insights
The average price of a single-family detached home in Edmonton for 2025-03 was $577,048.
This represents a gain of 5.6% from the previous month and a gain of 14.3% year-over-year.
The median price was $529,998, which indicates a balanced distribution of property values.
Want to know the most optimal time to list your property? Read our in-depth analysis on Best time of year to sell a house in Edmonton


Half-Duplex Market Insights
The average price of a half-duplex in Edmonton for 2025-03 was $431,269.
This represents a decline of 0.1% month-over-month and a gain of 3.9% year-over-year.
The median price was $430,000, showing a relatively uniform price distribution in this market segment.
Interested in homes without condo fees? View Edmonton Townhomes with No Condo Fees


Market Summary and Outlook
Based on the data analysis for Edmonton through 2025-03, the following market trends are notable:
Supply Trends: New listings have increased by 40.4% month-over-month, indicating growing inventory.
Demand Indicators: Sales volume has risen by 36.6% from the previous month, suggesting strengthening buyer activity.
Price Movement: Single-Family Homes: The mean sale price has increased by 5.6% month-over-month, while the median sale price has risen by 1.7%. Year-over-year, the mean price has appreciated by 14.3%, and the median price has increased by 13.4%.
Want to know all the costs associated with selling your home? Learn more in our article: How Much Does It Cost to Sell Your House in Alberta?
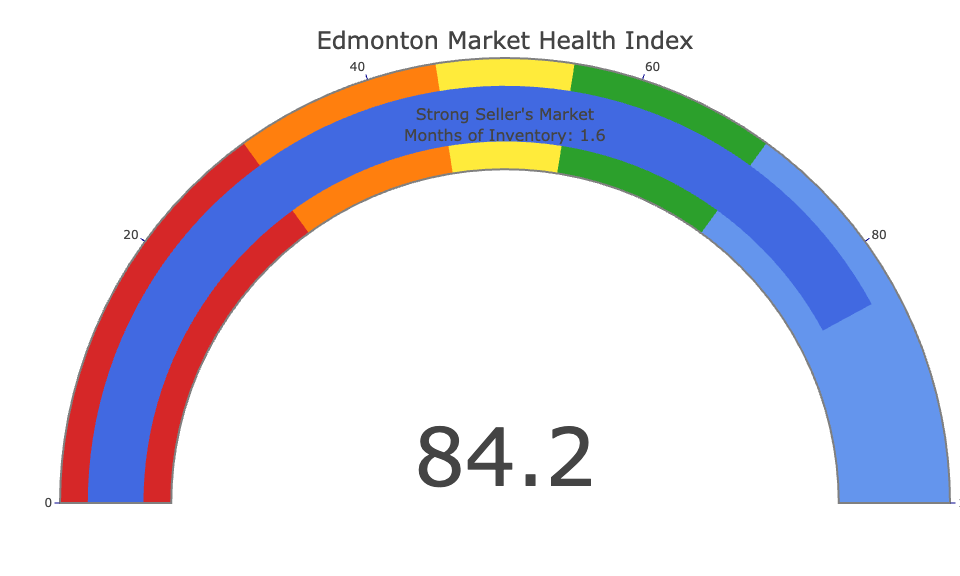
Overall Market Health Analysis
The Market Health Index provides a comprehensive measure of the current real estate market conditions in Edmonton.
Current Market Status: Strong Seller’s Market with an index value of 84.2.
Months of Inventory: 1.6 months (representing how long it would take to sell all active listings at the current sales pace).
This index considers the balance between supply and demand, with values above 50 indicating conditions favoring sellers and values below 50 favoring buyers.
Understanding Edmonton's real estate zones can help you target your search. Refer to our Edmonton zone map for more information.
Price-to-List Ratio Insights
In Edmonton, properties sold for a median of 99% of their list price in the most recent month.
32.8% of properties sold above their list price.
This metric is a key indicator of market competitiveness and pricing strategy effectiveness.
Values consistently above 100% suggest a seller’s market with competitive bidding.

Days on Market Insights
Properties in Edmonton spent a median of 17 days on the market before selling in the most recent month.
70.5% of properties sold in less than 30 days.
The decreasing trend in days on market indicates a strengthening market.

Neighborhood Market Insights
Top Performing Area: Keswick Area has the highest median sale price at $583,000.
Most Active Area: Chappelle Area had the highest sales volume with 160 transactions in the past 6 months.
Value Leaders: Downtown (Edmonton) offers the lowest price per square foot at $229/sq.ft..
Fastest Moving Market: Homes in Rutherford (Edmonton) sold the quickest, with a median of just 21 days on market.
Interested in exploring Edmonton's most affluent areas? Learn about the most expensive neighborhoods based on real estate data:


Seasonal Market Insights
Knowing when is real estate season, and therefore when do people sell houses and what time of year do people buy houses, helps you make informed decisions.
Peak Season: Based on historical patterns, May tends to be the most active month for home sales in Edmonton.
Slowest Period: Sales activity typically declines in December.
Year-over-Year Trend: Compared to the same time last year, the current sales volume is higher by 69%.


Price Distribution Insights
The most common price range in Edmonton is Under $300K, representing 30.9% of all sales.
Properties priced between $400K and $750K account for 44.5% of all transactions.
Luxury properties over $1M represent 1.9% of the market.

The Edmonton market saw price growth, lots of sales and more new listings in March 2025. Low inventory and high demand is driving house prices and competitive bidding is becoming more common. Whether you’re buying or selling, staying informed is key.
What’s Your Next Move?
Whether you're eyeing a single-family home, half-duplex, or luxury living, understanding the market is key. Sellers, know your numbers:
Let data-driven insights lead your next move, and reach out today to take advantage of the opportunities Edmonton's dynamic housing landscape presents.
Contact Us for personalized advice and guidance tailored to your needs.