Edmonton's housing market shows no signs of slowing down as it strides confidently into March 2024. Let's delve deeper to understand the latest trends shaping this dynamic market!
New Listings Overview
New listings exploded in March, reaching a total of 2662, a whopping 31% jump compared to the previous month. This surge in inventory signifies a vibrant market with plenty of options for potential buyers to explore.
Total Sold Overview
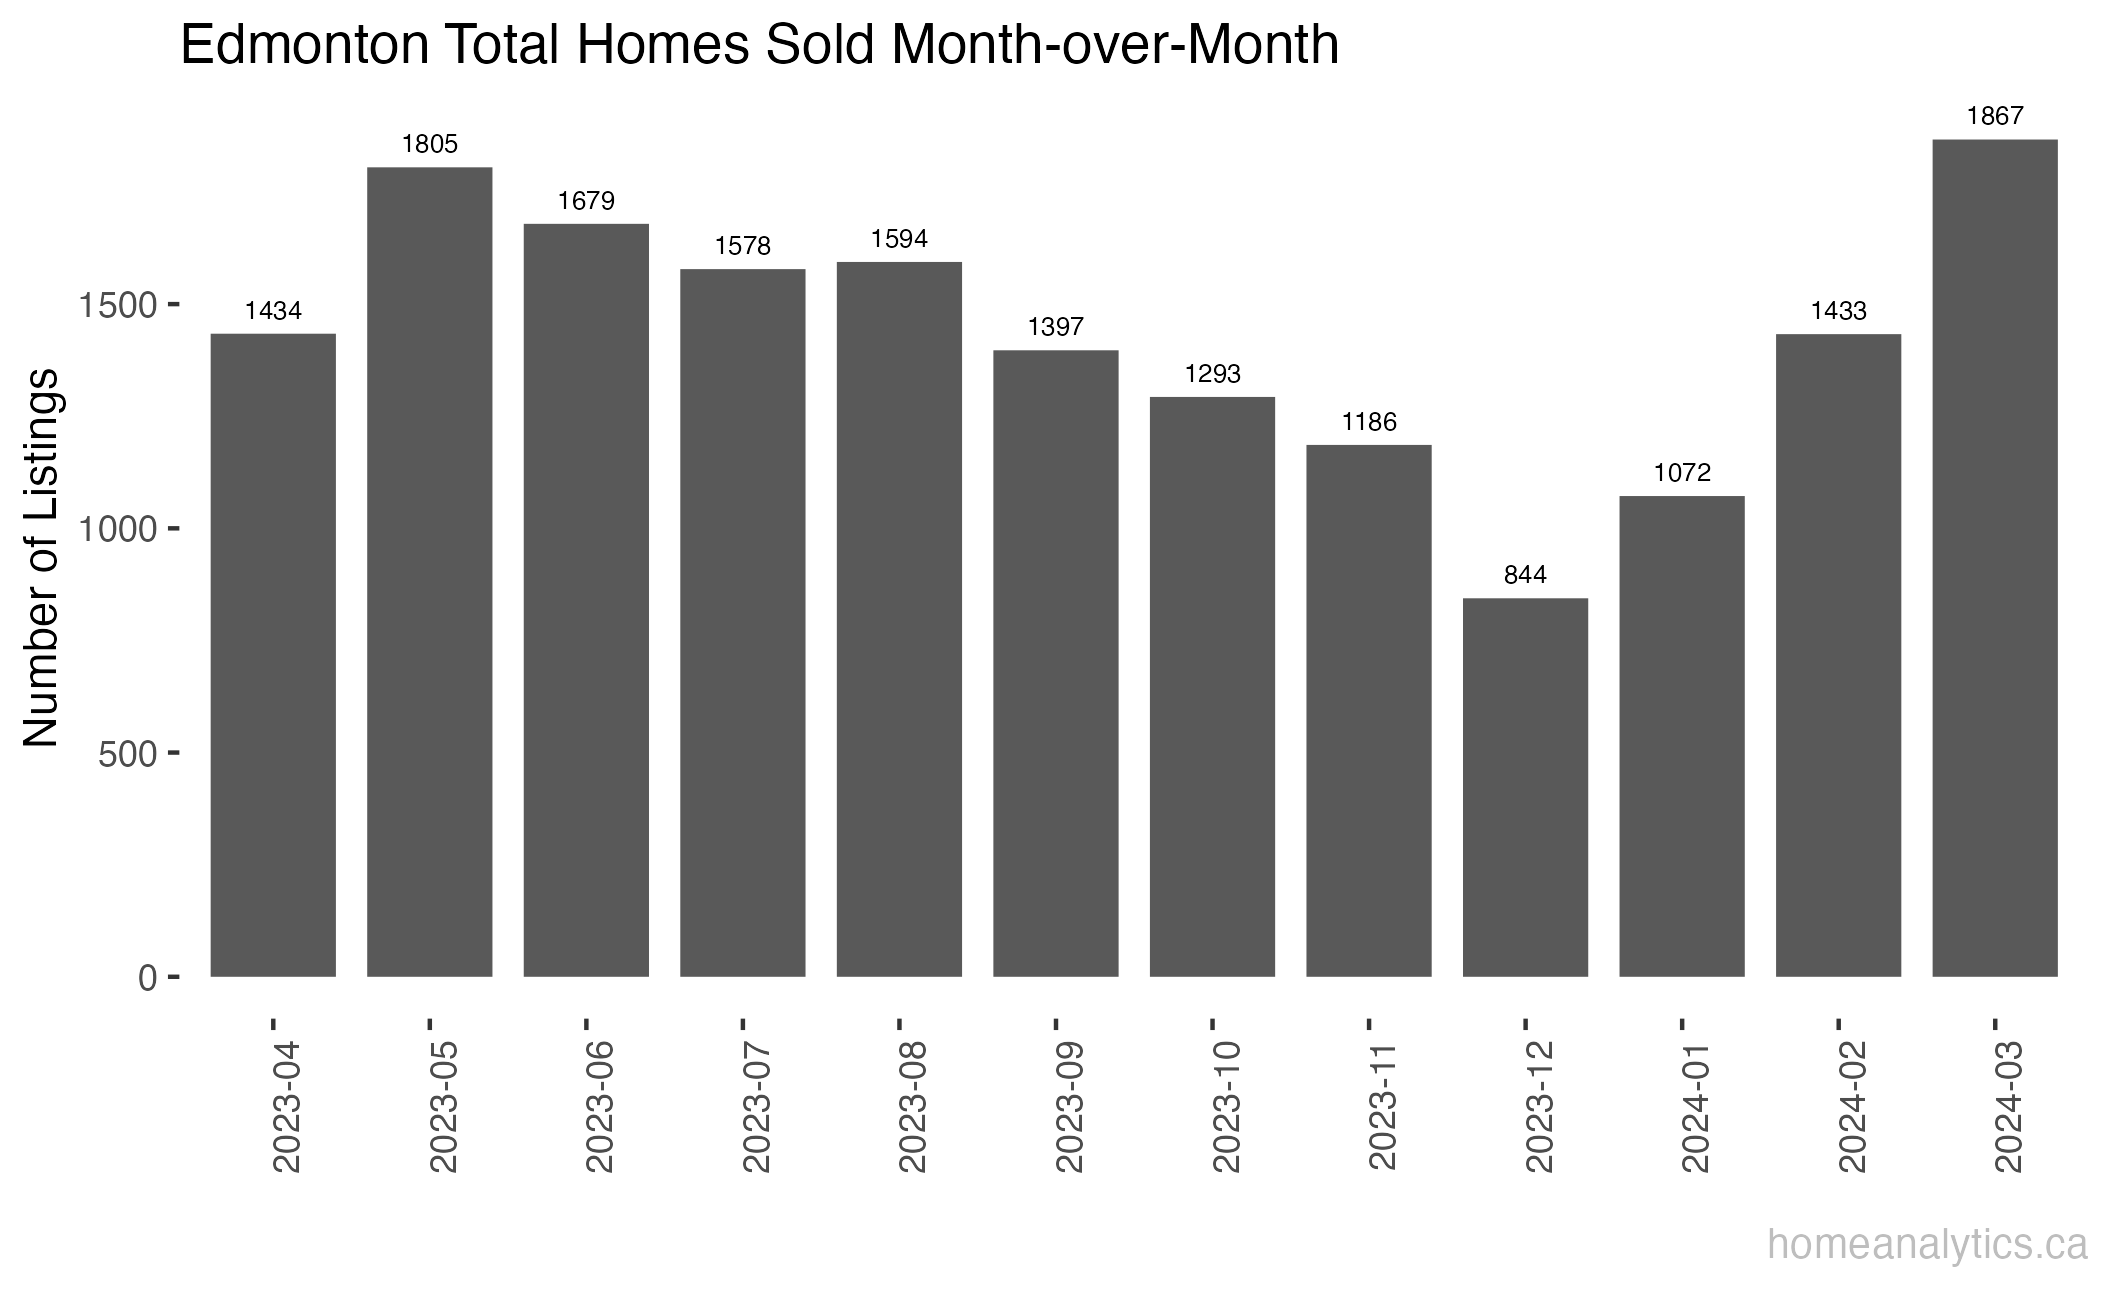
Sales activity kept pace with the influx of new listings. A total of 1,867 homes were sold in March, representing a significant 30.3% increase from February and a remarkable 45% year-over-year growth. This robust sales data highlights the ongoing buyer demand that continues to fuel Edmonton's housing market.

Edmonton Home Prices: A Breakdown
Let's dissect the latest home prices in Edmonton and see what trends are emerging across different property types.
Single-Family Detached Homes: Average house prices climbed steadily by 2.1% month-over-month, reaching a cool $504,804.4. Year-over-year, they've seen a healthy 6.4% jump, showcasing their enduring appeal and value.
Half-Duplexes: Looking for affordability with some breathing room? Look no further than half-duplexes! They're experiencing strong growth, with average prices hitting $414,913.1. That's a 3% increase from February and an impressive 11% year-over-year surge, making them an attractive option for budget-minded buyers.
Condominiums: Condo prices in Edmonton are on the rise! The average price shot up by 8.6% in March, reaching $190,446.5. While the year-over-year increase is a modest 0.8%, the condo market remains a solid choice with a variety of options for city dwellers.
Townhomes: Townhomes are a hot commodity in Edmonton! Average prices climbed by 2.2% month-over-month and a whopping 21.5% year-over-year, reaching $261,045.5. This significant growth reflects their popularity among buyers who crave a modern, space-efficient lifestyle.
Sales-to-New-Listing Ratio (SNLR)
The sales-to-new-listing ratio stood at 0.7 in March 2024, indicating a seller’s market. A high SNLR means more buyers and fewer sellers, leading to higher competition and increased house prices.
Cumulative Days on Market
Understanding the average days properties spend on the market provides valuable insights into market dynamics:
Detached Single-Family Homes: 60 days
Half-Duplexes: 53 days
Condominiums: 73 days
Townhomes: 36 days
These figures reflect the brisk pace of the housing market, particularly for townhomes, which spend the least amount of time on the market, showcasing their popularity among buyers.
Opportunities for Buyers and Sellers
For home buyers in Edmonton, increased inventory provide more options. Buyers may want to explore neighborhoods like Northwest Edmonton, Northeast Edmonton, Southeast Edmonton, and Southwest Edmonton to find their dream home.
For sellers, the strong sales activity and price appreciation, especially in the single-family and townhome segments, present a favorable market. Homeowners may want to consider listing their single-family homes, half-duplexes, or luxury homes to capitalize on the current market conditions.Buyers and sellers can also utilize ourinteractive map search and Edmonton zone map to explore the various neighborhoods and property types available in the city.
If you're considering buying or selling a home in Edmonton, our team of real estate experts at HomeAnalytics.ca is here to help. Contact us today to learn more about the current market conditions and how we can assist you with your real estate needs.
Disclaimer: Data sourced from the MLS. The analysis focused on the last five years of sold data in Edmonton Alberta. The information provided in this blog is ‘as is’ with no guarantee of accuracy or completeness.
.png)
