.png)
The Edmonton housing market shows mixed signals with decreasing sales activity and new listings but increasing property prices. As of June 2025, new listings decreased 13.5% month-over-month to 3,216 homes while total sales fell 8.4% to 1,946 properties.
New Listings Insights
The number of new homes listed in Edmonton for 2025-06 was 3,216, representing a decline of 13.5% from the previous month.
The 12-month trend line indicates a gradual increase in listing volume over the past year.
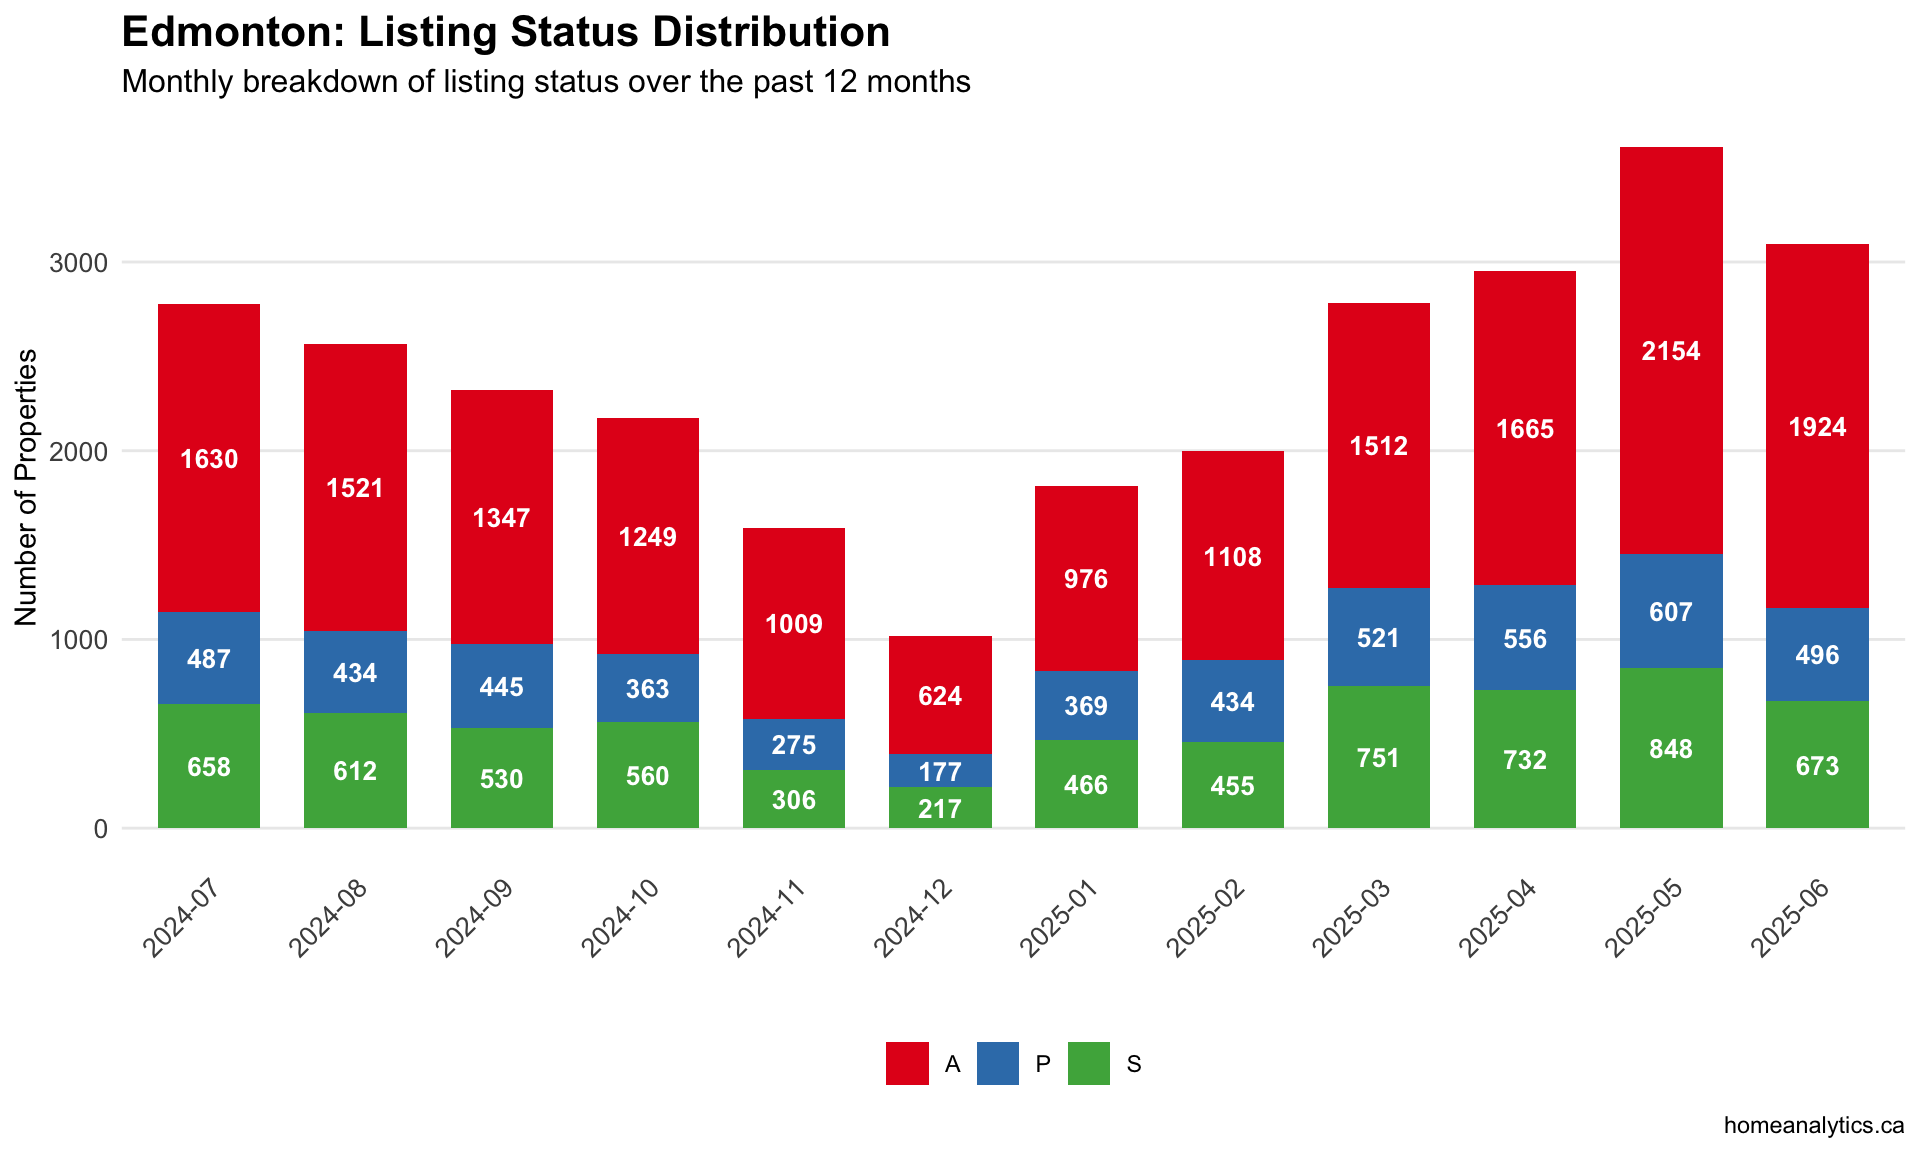
2025-06 saw a significant decline in new listings in recent months.
Sales Activity Insights
Total homes sold in 2025-06 was 1,946, a decline of 8.4% from the previous month.
Year-over-year, sales volume has changed by 6.5% compared to the same month last year.
The sales trend over the past 12 months shows positive momentum in the Edmonton market.

Edmonton Home Prices: What You Need to Know
The average house price in Edmonton reached $565,014 for single-family detached homes in June 2025. This represents a modest 0.5% monthly increase and a substantial 6.5% gain year-over-year.
The median price sits at $519,900, indicating some high-value sales pulling the average upward. For buyers concerned about Edmonton house prices trend, this data suggests continued appreciation despite economic headwinds.


Half-Duplex Market Insights
The half duplex for sale Edmonton segment outperformed single-family homes with prices rising 2.5% month-over-month to $458,939. Year-over-year growth reached 6.5%, demonstrating consistent demand for this property type.
The median price of $441,500 shows uniform pricing distribution, making this segment predictable for both buyers and sellers. Half-duplexes offer an attractive alternative for buyers seeking lower entry points to homeownership while maintaining many features of detached homes.


Market Summary and Outlook
The Edmonton housing market demonstrates mixed signals with decreased activity across key metrics. New listings fell 13.5% to 3,216 homes while sales decreased 8.4% to 1,946 properties in June 2025. The market health index of 83.7 confirms strong seller conditions with just 1.7 months of inventory.
For those tracking Edmonton home prices, the 6.5% year-over-year appreciation in single-family homes signals sustained growth despite economic challenges. Buyers face competitive conditions while sellers benefit from favorable pricing power heading into the peak spring season.
Price-to-List Ratio Insights
Edmonton properties sold for a median 99% of list price in June 2025, with 22.4% of homes selling above asking price. This metric confirms the competitive nature of the current market and effectiveness of strategic pricing.
Sellers working with agents to determine house value Edmonton benefit from accurate valuation to maximize returns. The strong price-to-list ratio suggests sellers maintain negotiating leverage while buyers need prepared offers to secure properties in desirable areas.

Days on Market Insights
Properties in Edmonton spent a median of 22 days on the market before selling in the most recent month.
63.8% of properties sold in less than 30 days.
The decreasing trend in days on market indicates a strengthening market.

Neighborhood Market Insights
Top Performing Area: Keswick Area has the highest median sale price at $582,000.
Most Active Area: Wîhkwêntôwin had the highest sales volume with 190 transactions in the past 6 months.
Value Leaders: Wîhkwêntôwin offers the lowest price per square foot at $212/sq.ft..
Fastest Moving Market: Homes in Summerside sold the quickest, with a median of just 16 days on market.

Year-over-Year Market Trends
2025 Q1 showed negative momentum with sales decreasing by 2.3% compared to the same period last year. June showed a 6.5% increase compared to the same month last year, indicating moderate momentum.
The Edmonton real estate market has experienced contraction year-over-year for the comparable period, with sales volumes decreasing by 17.8% when comparing the same months from both years.

Conclusion
The Edmonton housing market continues to favor sellers with key indicators pointing to sustained strength. The combination of limited inventory (1.7 months), strong price-to-list ratios (99%), and relatively quick sales (22 days median) creates favorable conditions for homeowners considering listing their properties.
While single-family homes show steady appreciation at 6.5% year-over-year, half-duplexes demonstrate particularly strong momentum with 6.5% annual growth.
Ready to Make Your Move in Edmonton's Market?
Whether you're looking to sell your current home or purchase in one of Edmonton's thriving neighborhoods, having expert guidance makes all the difference. Our team specializes in helping sellers understand the average cost for selling a house and maximize returns in this competitive market.
Contact us today for a personalized market analysis of your property or to explore available listings across Edmonton.