.png)

August Market Overview
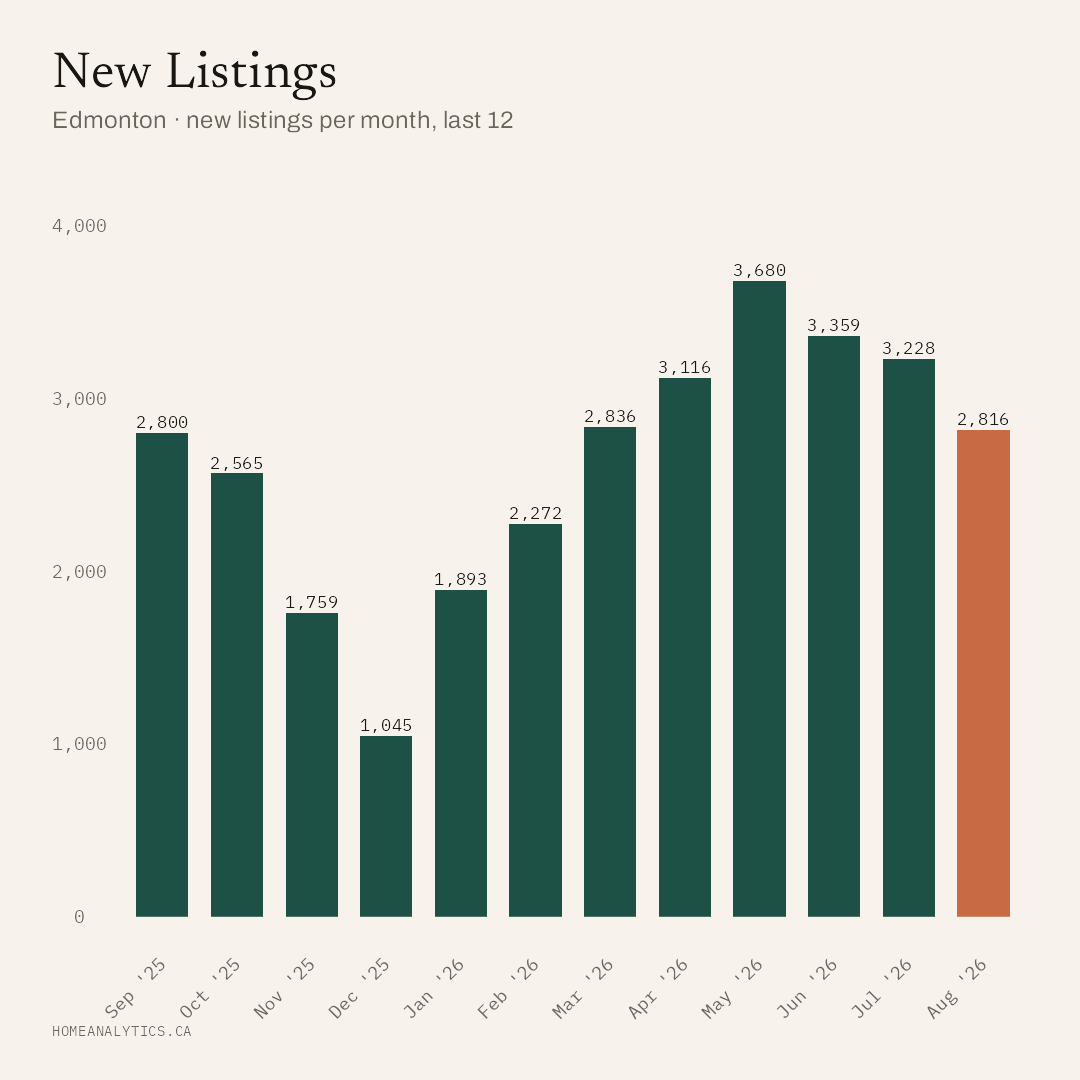
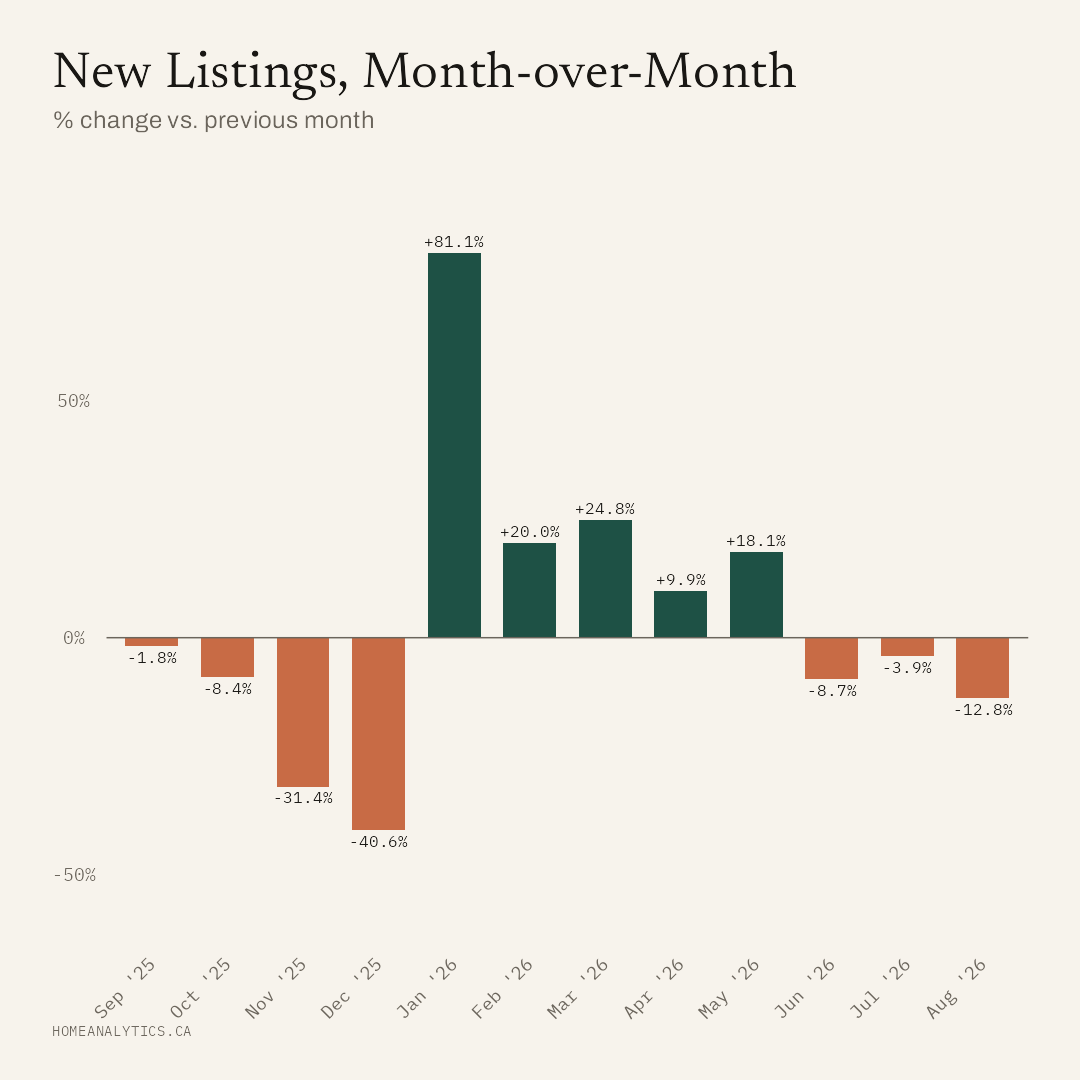
Supply Trends: New listings have decreased by 12.8% month-over-month, indicating tightening supply.
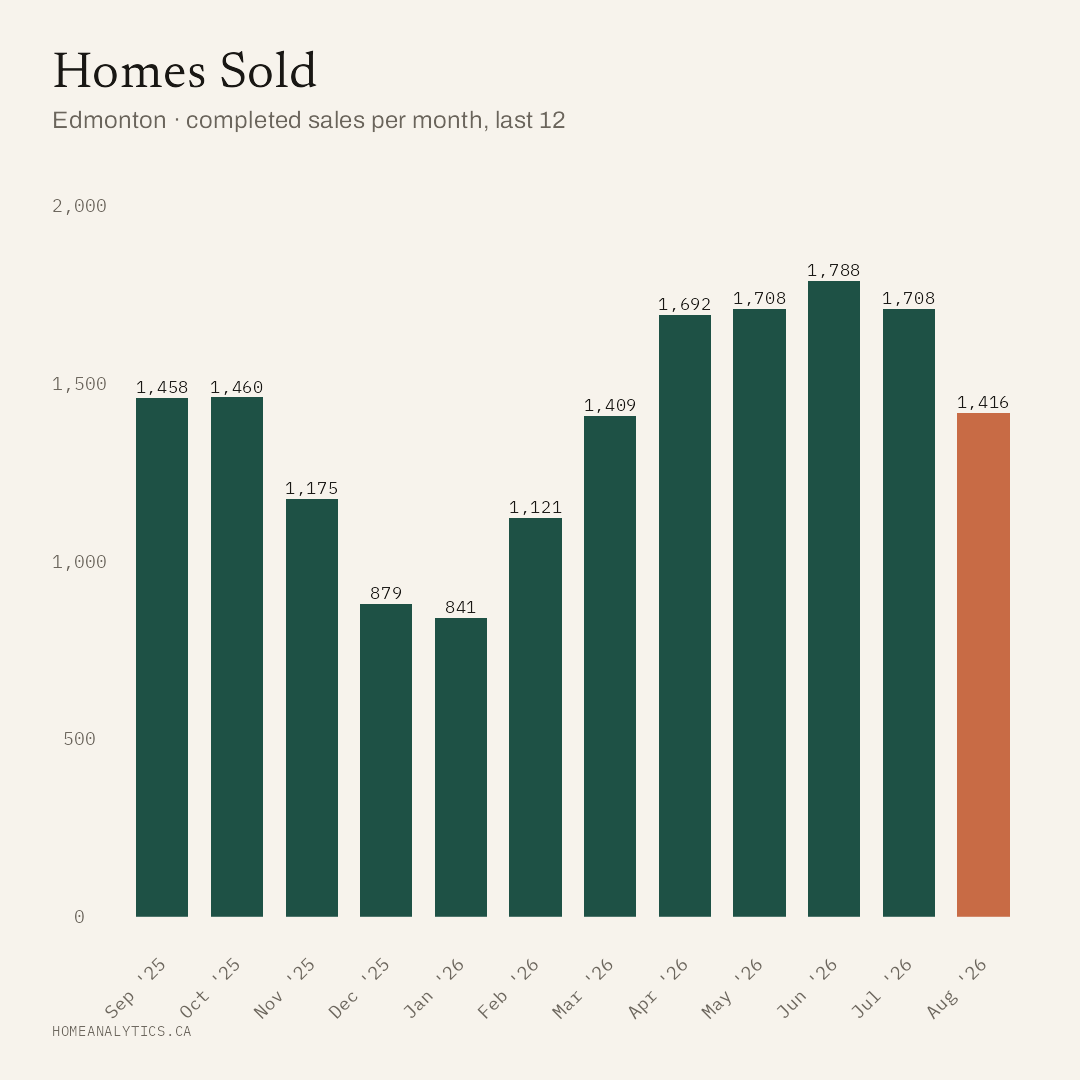
Demand Indicators: Sales volume has fallen by 17.1% from the previous month, suggesting softening demand.
Year-over-year, the mean price has appreciated by 1.1%, and the median price has fallen by 0.7%.
Properties sold for a median of 98% of their list price in the most recent month.
12.3% of properties sold above their list price.
The number of new homes listed in Edmonton for 2026-08 was 2,816, representing a decline of 12.8% from the previous month. There was gradual increase in listing volume over the past year.
Homebuyers in the Edmonton area also saw a shift in market activity in August, with 1,416 homes sold during the month. Sales declined 17.1% from the previous month and were down 16.1% compared to August 2025.
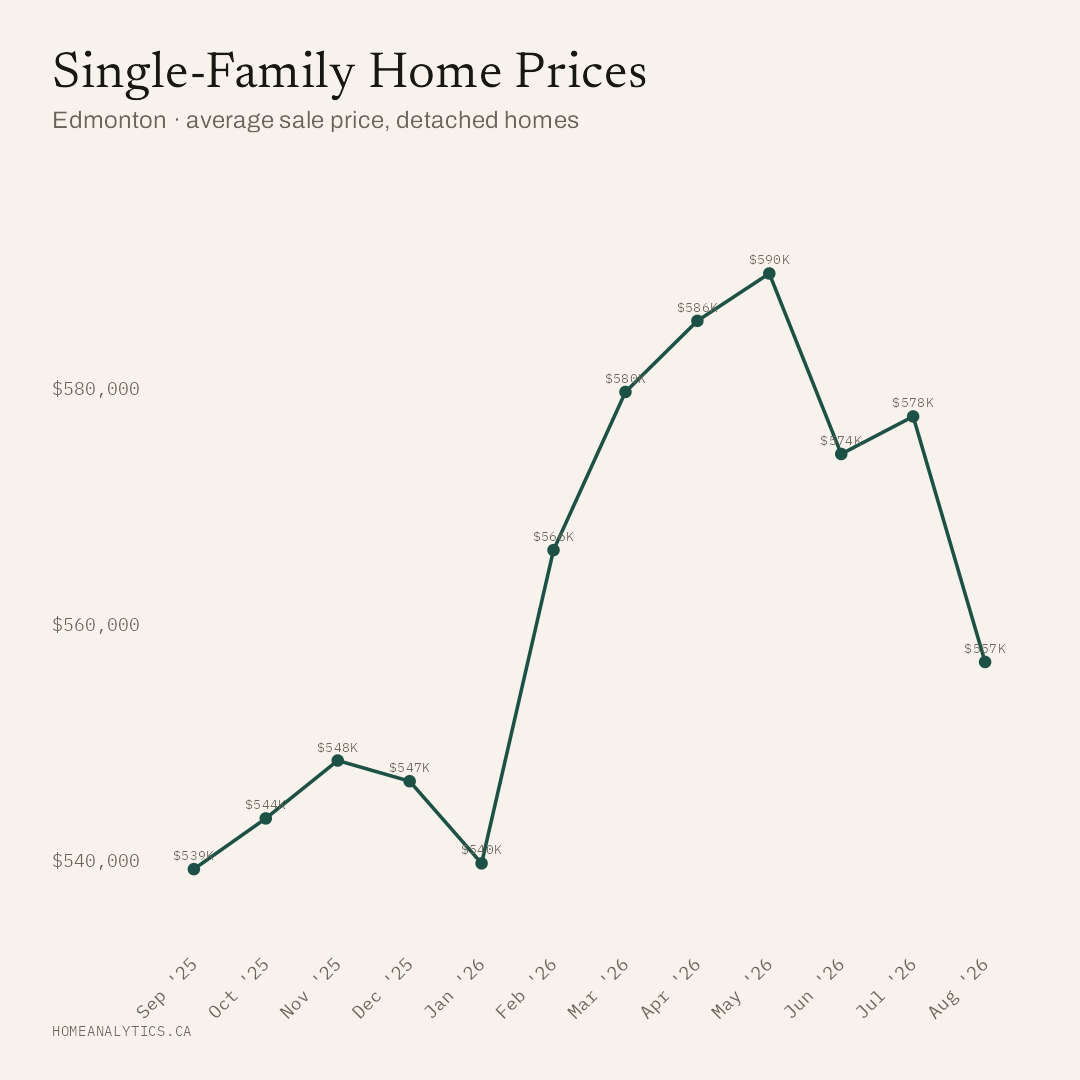
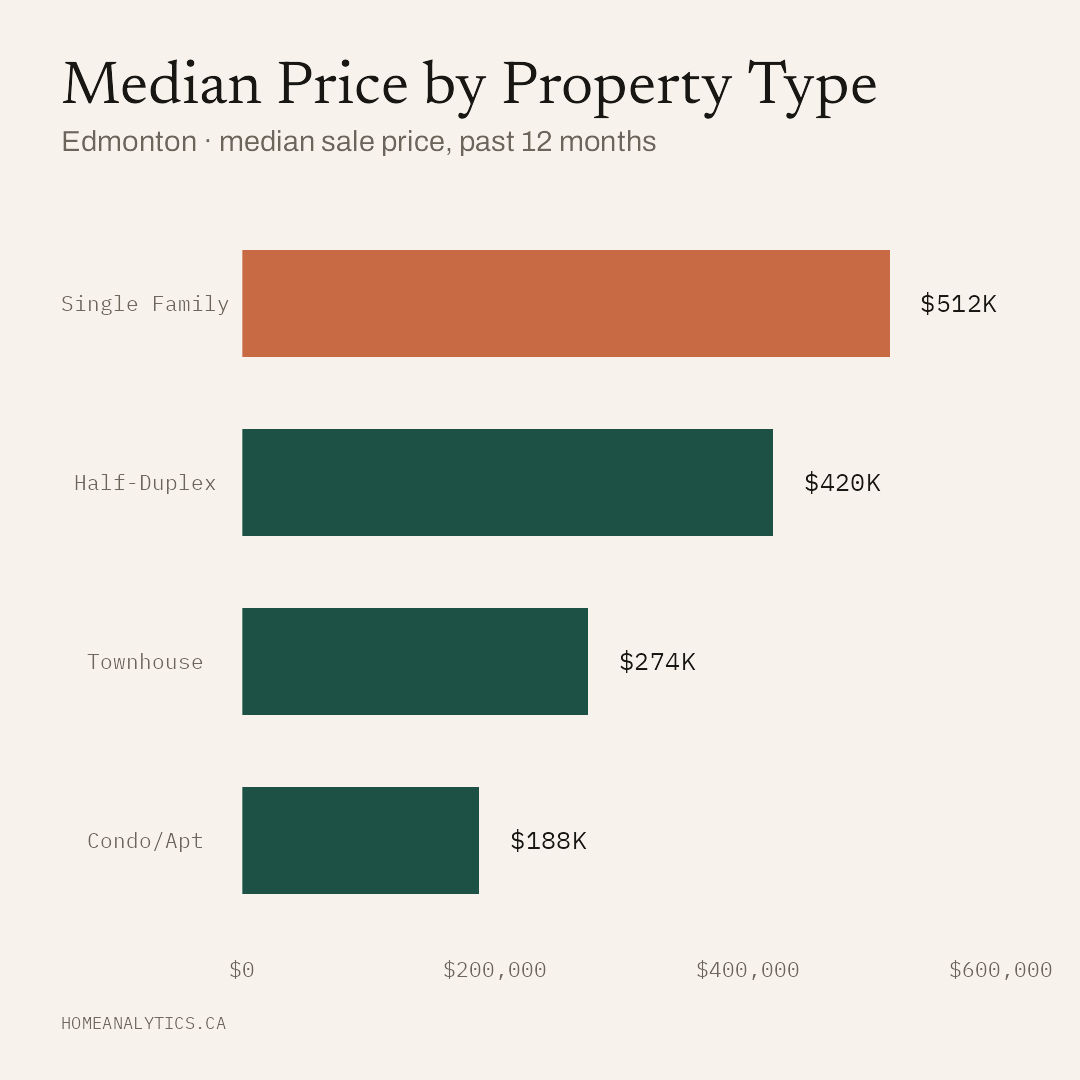
The average price of a single-family detached home was $556,784, up 1.1% from a year earlier, while the median price was $504,761, down 0.7% year over year.
Single Family Detached Homes
The average price for single-family detached homes declined 3.6% from July, while the median price fell 2.9% month over month.
Duplex
Edmonton’s half-duplex market also experienced price declines in August. The average price was $414,679, down 5.9% from the previous month and 5.0% from a year earlier. The median price was $405,000, representing a 3.6% month-over-month decline and a 4.2% year-over-year decline.
Condominium
Condominium prices remained relatively stable on an average-price basis in August. The average price was $208,262, down just 0.2% from July and up 0.6% year over year. The median condominium price was $185,500, down 3.4% month over month and 6.3% compared to August 2025.
Townhomes
Townhomes were the strongest-performing property type on a month-over-month basis in August. The average price rose 3.5% to $277,480, although it remained 0.9% below the level recorded a year earlier. The median price increased 1.3% from July to $266,000, but was down 5.0% year over year.
Sales-to-New-Listing Ratio
The sales-to-new-listing ratio for Edmonton was 0.50 in August, indicating that approximately half of newly listed properties were sold during the month.
Days on the Market
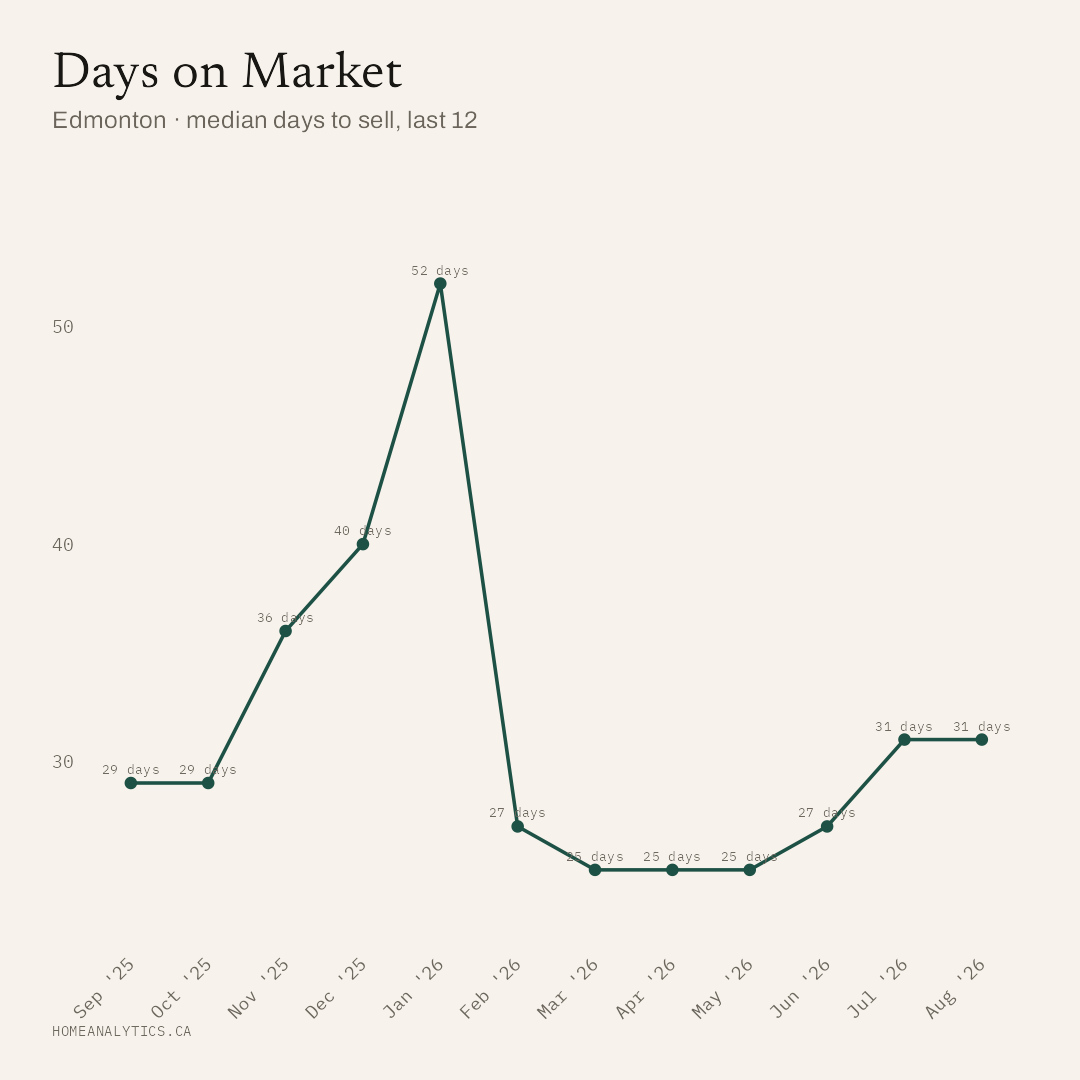
Homes in Edmonton spent varying amounts of time on the market before selling in August. Detached single-family homes spent 59 days on the market, while duplexes averaged 75 days. Condos and apartments spent 81 days on the market, townhomes averaged 66 days, and residential attached homes averaged 75 days.
Neighborhood Market Insights
Top Performing Area: Windermere has the highest median sale price at $545,000.
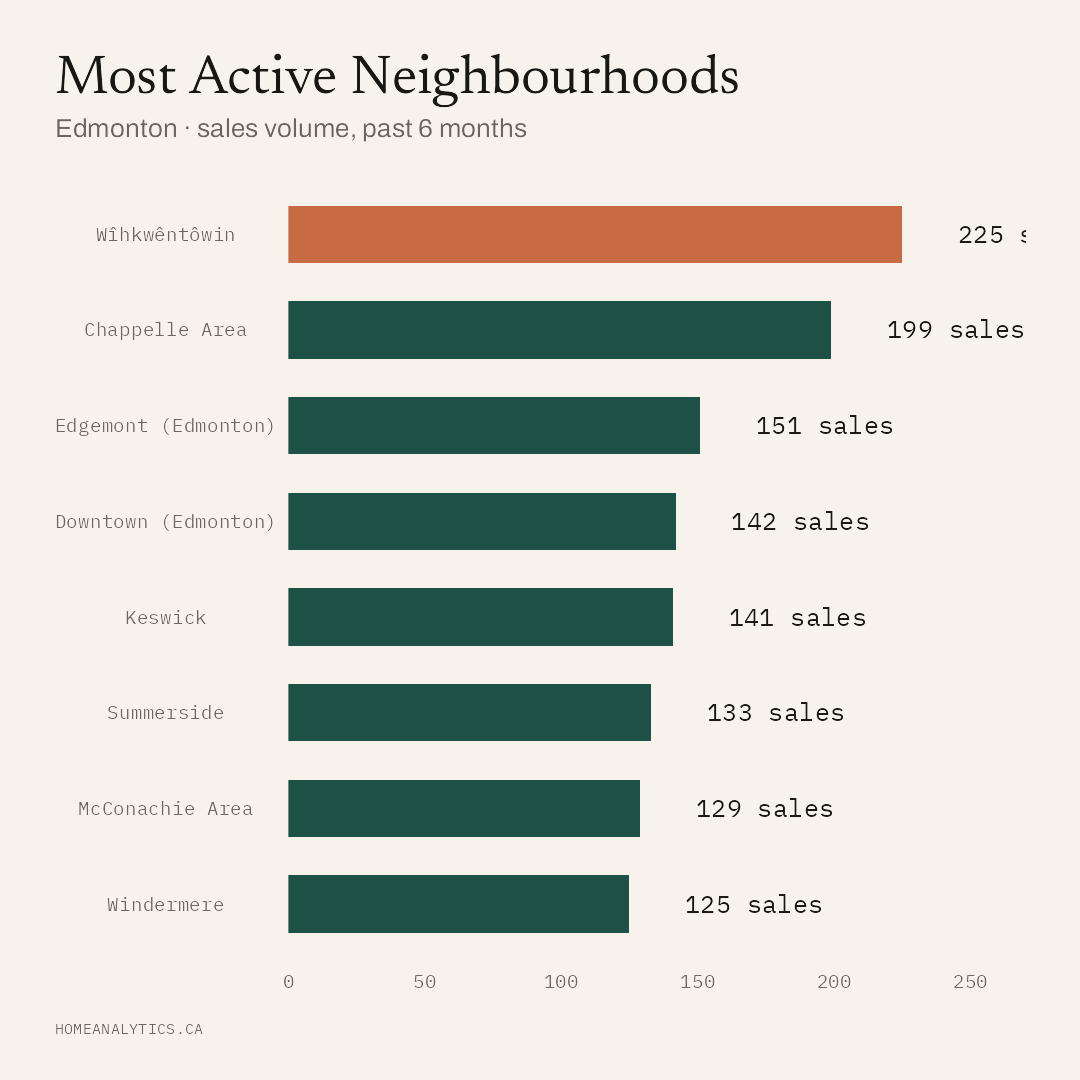
Most Active Area: Wîhkwêntôwin had the highest sales volume with 225 transactions in the past 6 months.
Value Leaders: Wîhkwêntôwin offers the lowest price per square foot at $211/sq.ft..
Fastest Moving Market: Homes in Summerside sold the quickest, with a median of just 24 days on market.
Year-over-Year Analysis Summary
Based on the comprehensive year-over-year analysis comparing 2025 to 2026:
Total Sales: Edmonton recorded 11,683 sales, down 9.1% from 12,852 sales in 2025.
Average Price: The average home price increased 3.2% year-over-year to $448,388, compared with $434,590 in 2025.
Median Price: The median home price rose 1.2% year-over-year to $420,000, up from $415,000 in 2025.
Average Days on Market: Homes spent an average of 42 days on the market, up 21.7% from 34 days in 2025, indicating that properties are taking longer to sell.
Total Listings: Edmonton recorded 23,200 total listings, an increase of 1.0% from 22,975 listings in 2025.
Ready to make your move?
For sellers: Check out our guide on the best time of year to sell a house in Alberta and learn how much it costs to sell your house in Alberta.
For buyers: Browse luxury condos for sale in Edmonton or explore St. Albert single-family homes.
Use our net proceeds calculator to see what you'll walk away with when you sell, or explore the 2023 Edmonton zone map to find your next neighborhood.