Get a glimpse into the Edmonton real estate market for the month of January 2023
-
Total Homes Listed: 1727 homes were listed for sale in Edmonton in January 2023, a 79.7% increase from the previous month.
-
Total Homes Sold: 702 homes were sold in Edmonton in January 2023, a 3.2% increase MoM (Month-Over-Month) and a 31.1% decrease YoY (Year-Over-Year).
-
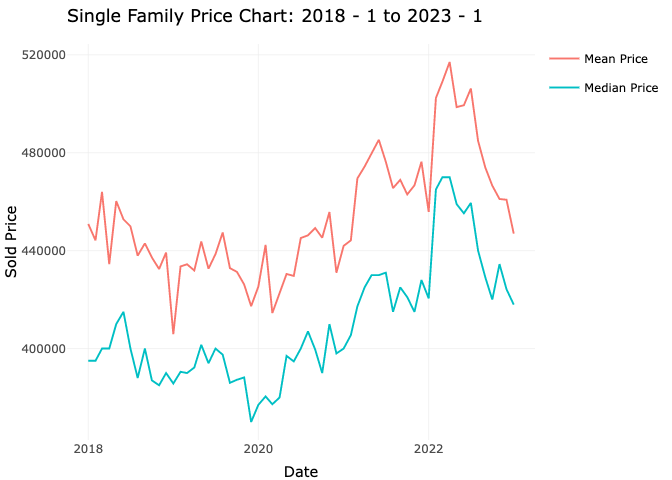
Average Price of Single-Family Detached Homes: $446,954.6, with a -3% MoM change and a -1.9% YoY change.
-
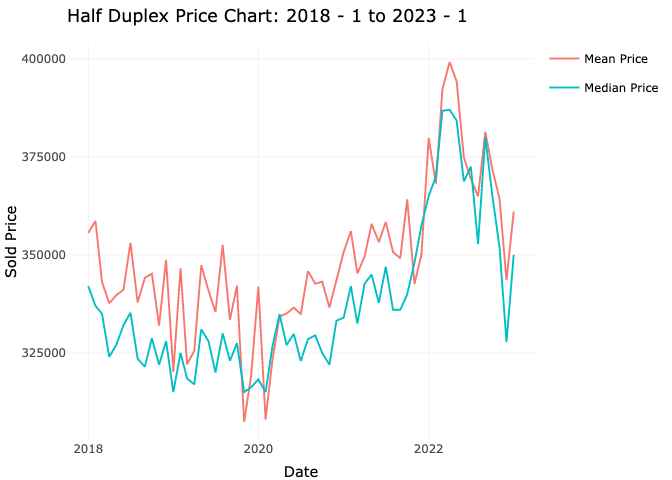
Average Price of Half-Duplexes: $361,055.2, with a 5.1% MoM change and a -4.9% YoY change.
-
Average Price of Condominiums: $173,211.4, with a -0.1% MoM change and a -8.2% YoY change.
-
Average Price of Townhomes: $244,827.0, with a 3.9% MoM change and a 1% YoY change.
-
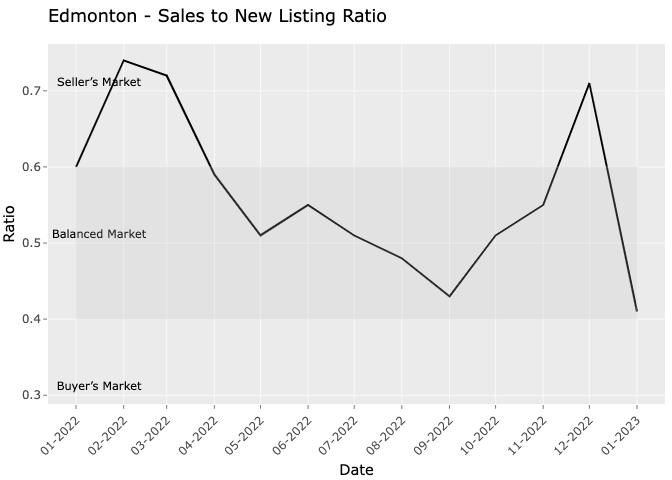
Sales-to-New-Listing Ratio: 0.41 for the month of January 2023.
Sales-to-new-listing ratio
The sales-to-new-listing ratio is an important indicator of the balance between supply and demand in the real estate market. A ratio of 0.41 in January 2023 means that there were 0.41 sales for every new listing in the month, indicating that we are very close to a buyer's market.

Cumulative Days on the Market:
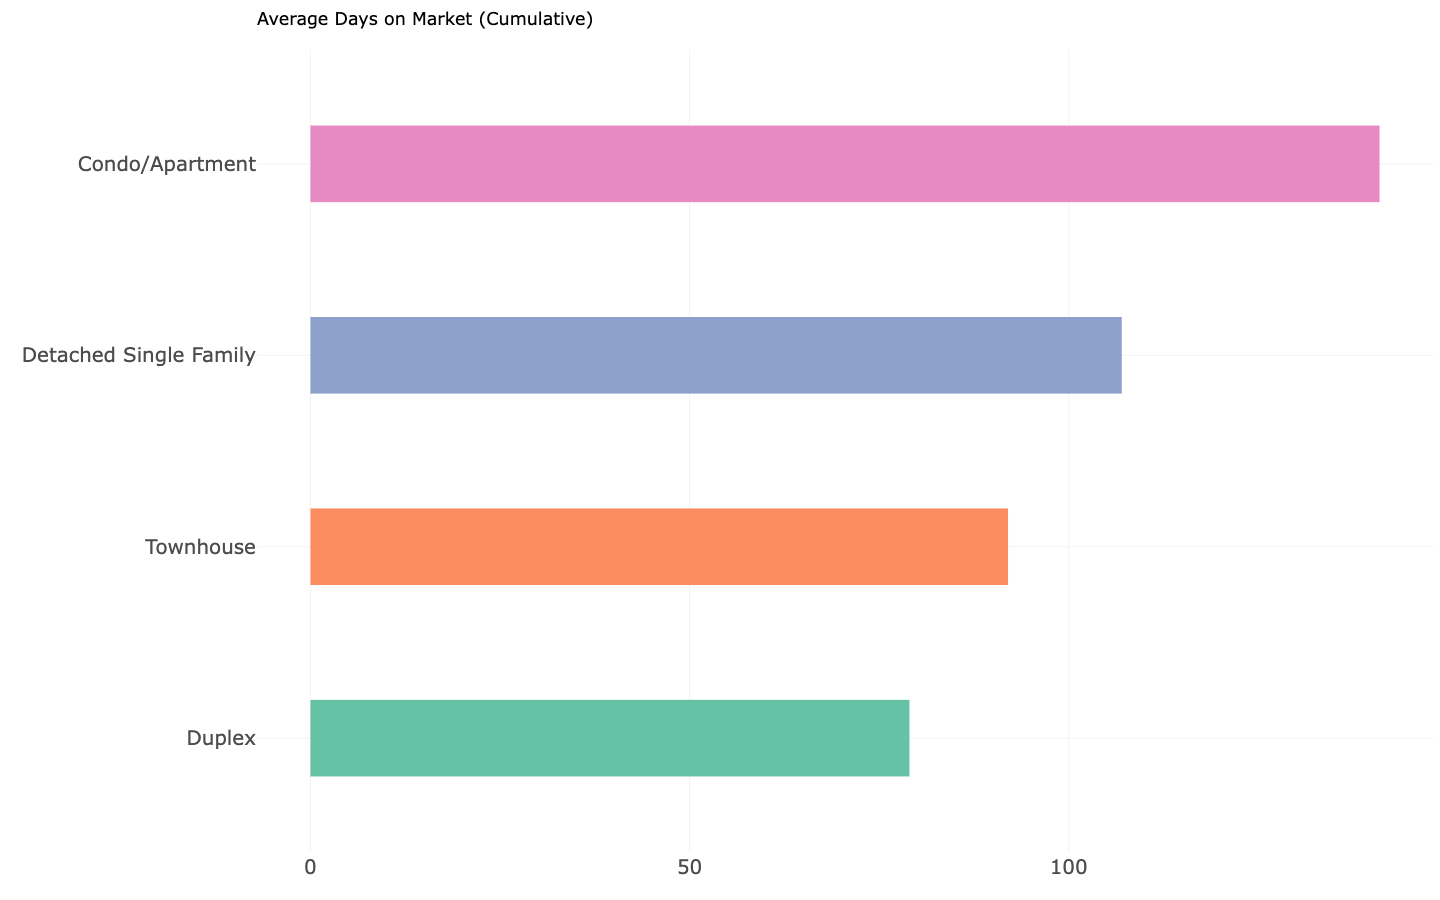
Detached single-family homes spent 107 days before selling. Duplex properties had a slightly quicker turnover, spending an average of 79 days on the market. On the other hand, condo/apartment properties took longer to sell, with an average DOM of 141 days. Townhomes in the area had a moderate DOM of 92 days.

The average home prices in Edmonton
The average price of a single-family detached home in Edmonton was $446,954.6, with a -3% MoM change and a -1.9% YoY change. This trend in pricing may indicate a slight dip in the market for single-family detached homes in the area, making it a good time for buyers to consider this type of property.
The average price of a single-family detached home in the area experienced a drop in price, with a MoM decrease of -3.0% from $460,792.3 to $446,954.6 and a YoY decrease of -1.9% dropping from last year's price of $455,798.1.

Meanwhile, the half-duplex market in Edmonton saw an upward trend with an MoM price increase of 5.1%. However, there was a decrease of -4.9% YoY dropping from $379,793.0 to $361,055.2.

Edmonton condo market saw a decrease of -0.1% MoM and -4.3% YoY. The townhouse market in the area showed a positive MoM price increase of 3.9% and a slight YoY price increase of 1%.
Year-over-year (YoY) Edmonton house prices fell across all categories, with the exception of the townhome market, which showed a slight increase.
Conclusion
It's important to keep in mind that real estate markets can be localized, and the average price may not accurately reflect the pricing of specific homes or neighborhoods. Factors such as location, size, age, and condition of the property can also greatly influence its value.
Get neighbourhood specific insights
.png)