Overview
-
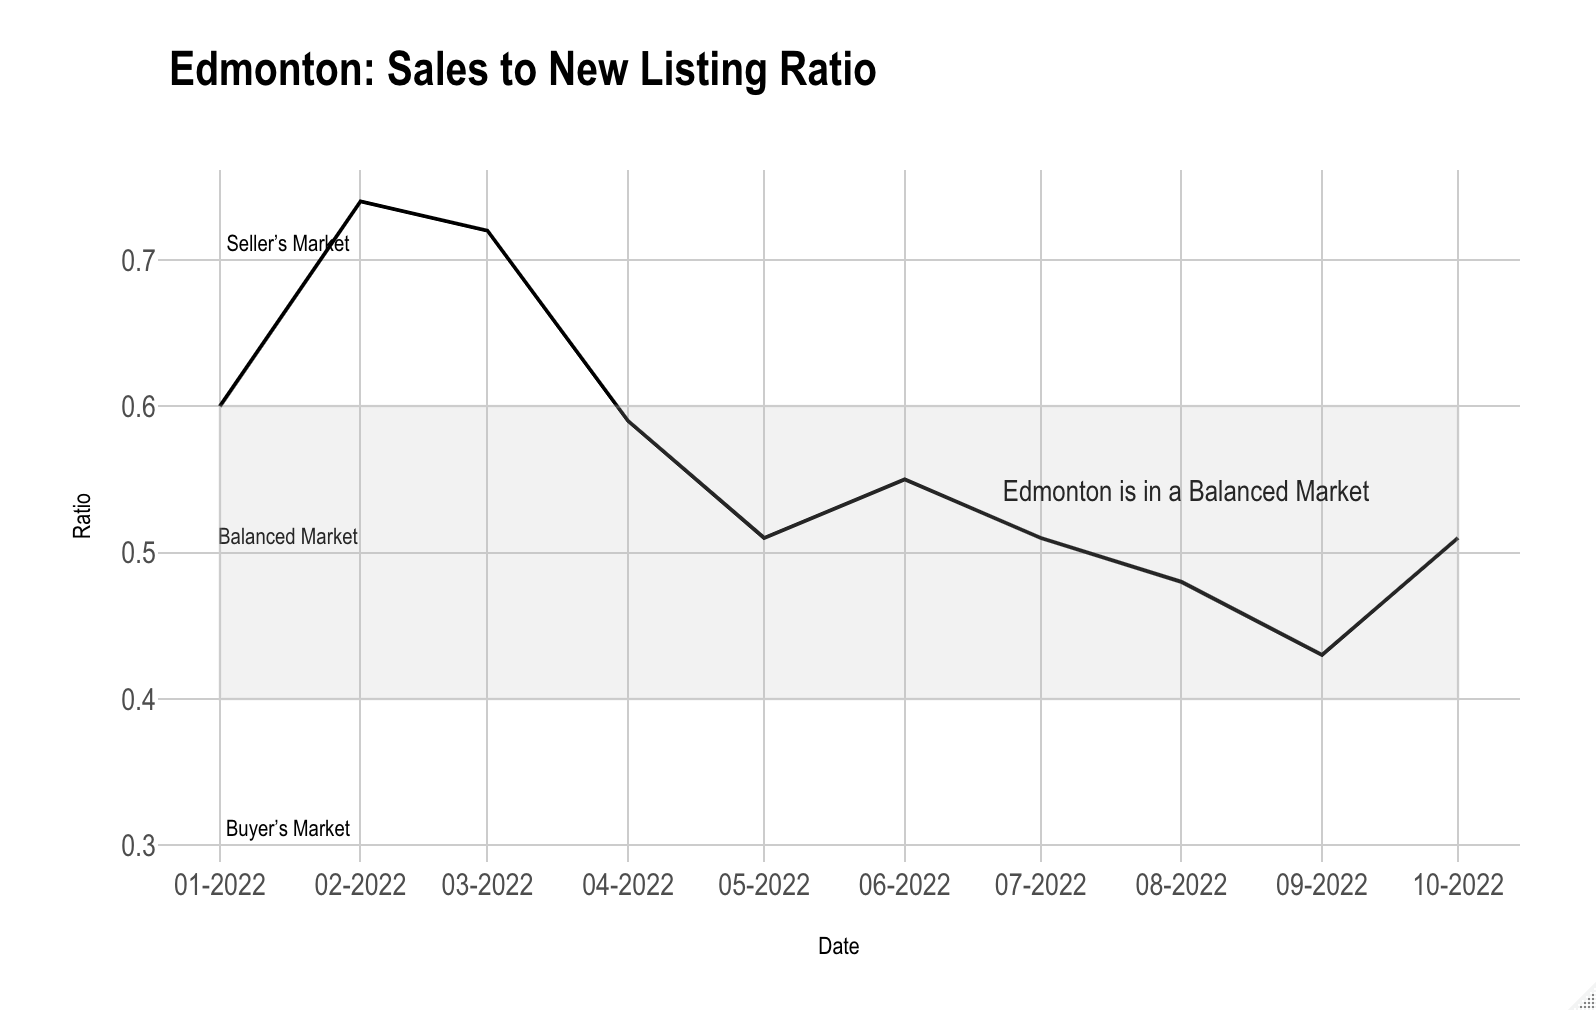
Edmonton is in a balanced market with a sales-to-new listing ratio of 0.5.
-
The total number of homes sold in October saw a month-over-month decline of 5% and a year-over-year decline of 22%.
-
The demand for homes in the Edmonton real estate market has been trending downwards, with fewer buyers purchasing homes.
-
While the buyers are holding back, the sellers are doing the same as new listings declined by 19%.
-
The average price of single-family detached homes and duplexes both saw an MoM decline of 2%.
-
New Housing Starts in Alberta have seen a 59.1% increase YoY, with 42% of all new homes being single-detached units and 9% being semi-detached units.
-
Net migration in the second quarter of 2022 saw a dramatic increase of 3,225%.
Sales-to-New Listing Ratio
The Sales-to-New Listing Ratio for the Edmonton Real Estate Market in October was 0.5, indicating balanced market conditions. This means that there were an equal number of homes being sold and newly listed within the month.
New Listings
Month-over-month change: -19%. There has been a significant decrease in new listings month-over-month and year-over-year for the Edmonton real estate market. In October, total new listings dropped by 19%, from 2,442 to 1,987. New listings have been trending downward for the past 5 months. Looking at the trend in new listings over the past few months, it is evident that fewer homes are now being listed on the market.
Browse all MLS Listings for the Greater Edmonton Area
Total Sold Listings
-
Month-over-month change: -5%. The number of homes sold in October decreased by 5% compared to the previous month, from 1058 to 1007.
-
Year-over-year change: -22%. Overall, the demand for homes in the Edmonton real estate market has been trending downward YoY, with fewer buyers purchasing homes.
-
This can be attributed to a slowing economy and high levels of uncertainty due to economic factors such as high inflation and interest rates.
Single-Family Detached Homes
-
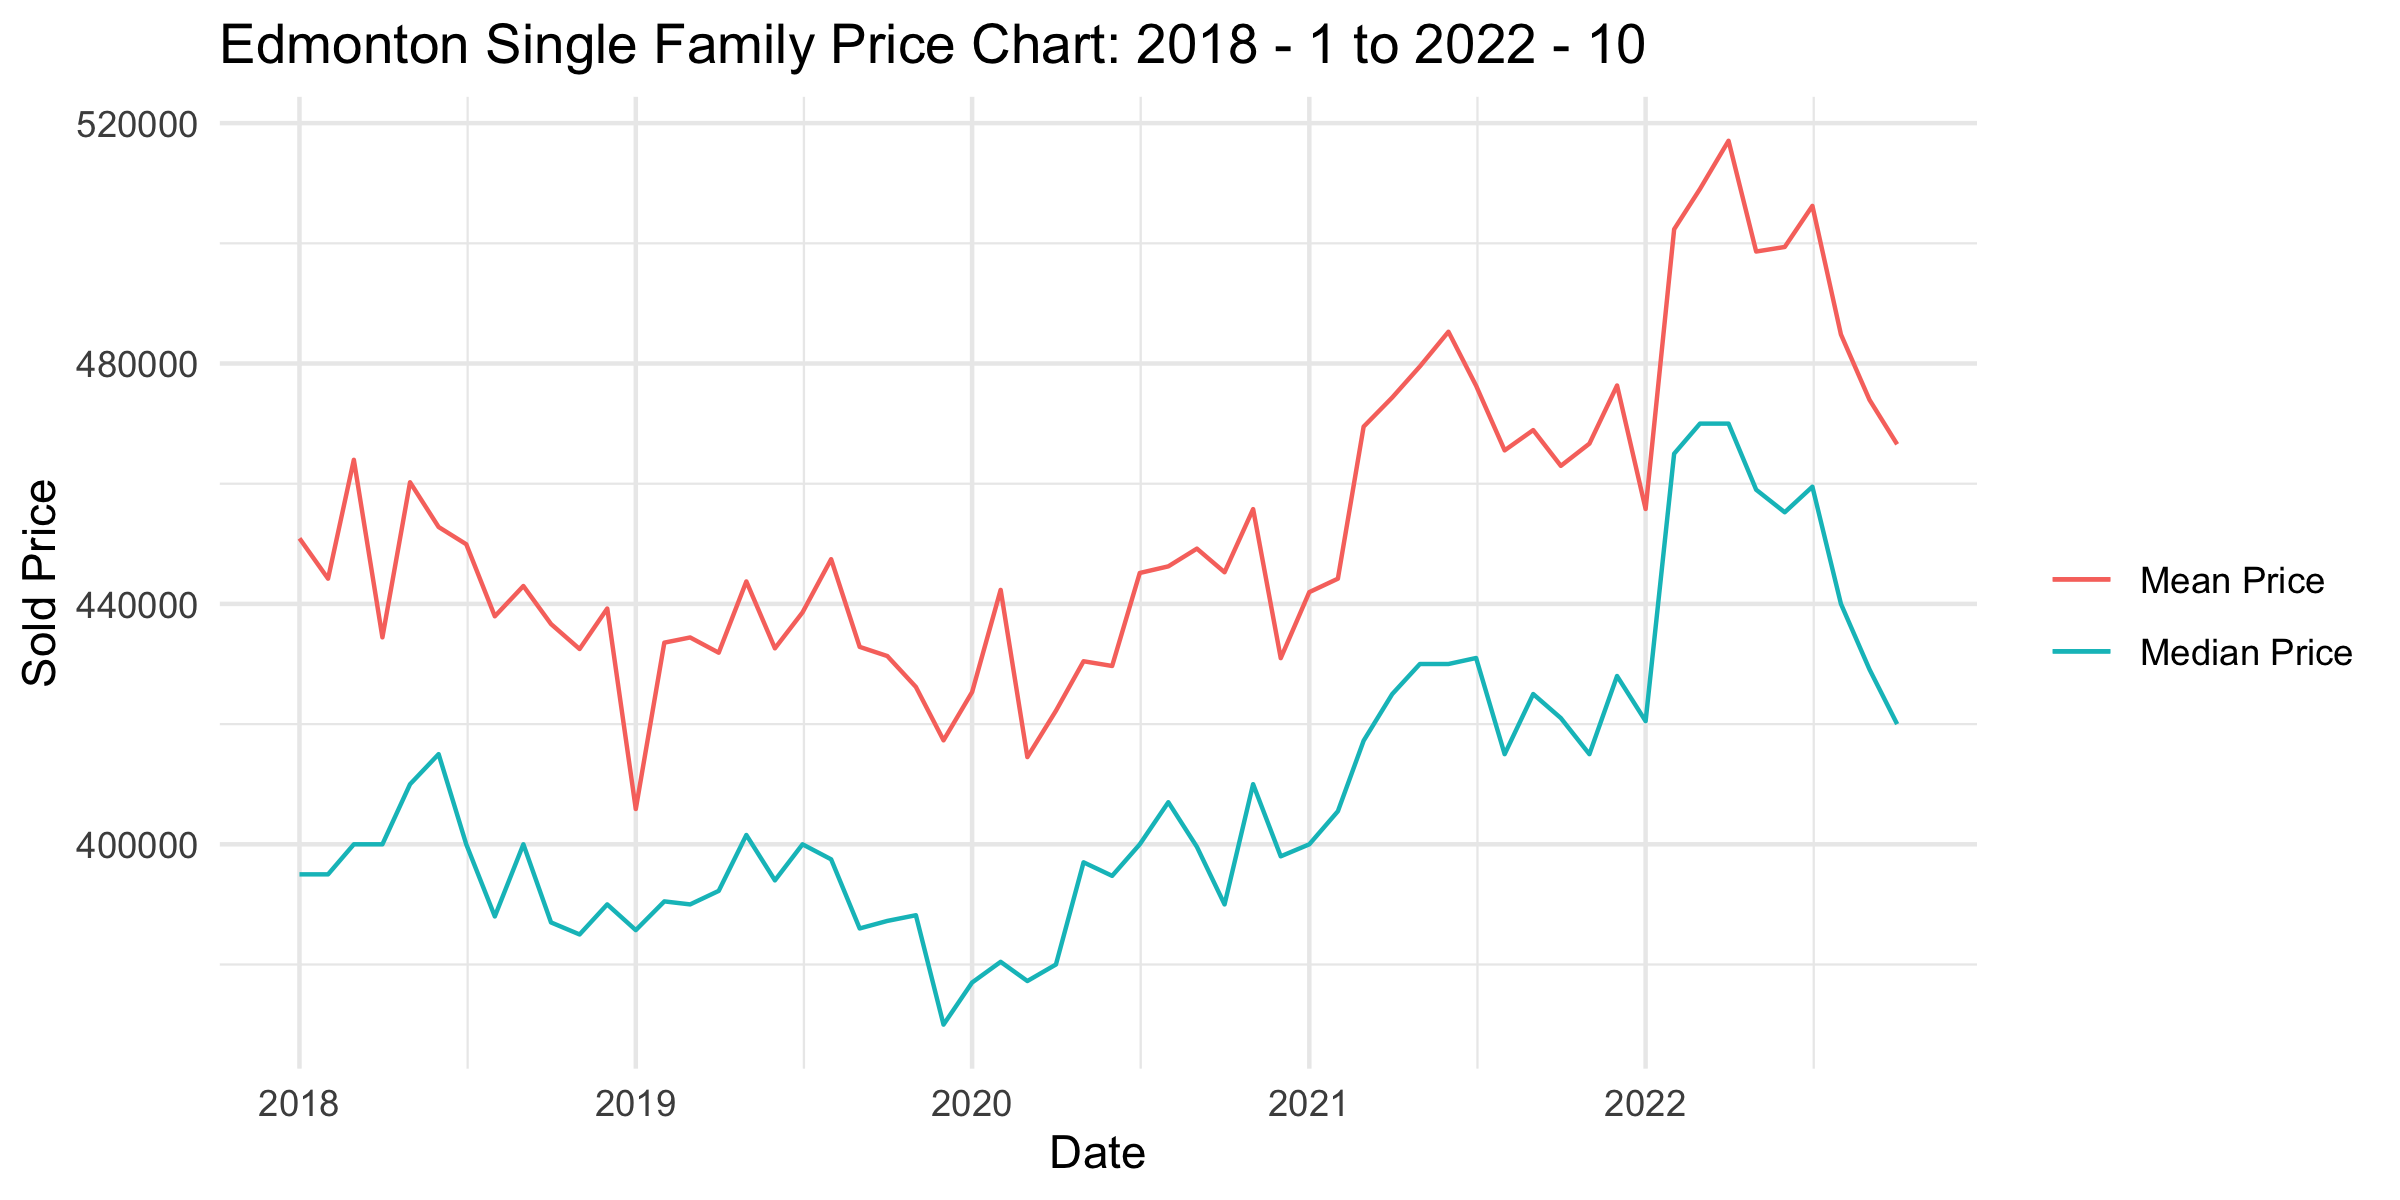
Month-over-month change: -1.6%. In October, average values dropped by 1.6%, from $473,958 to $466,559.
-
Year-over-year change: 0.78%. The YoY price change for single-family detached homes increased by 0.78% as the mean prices increased from $462,972 to $466,559.
Half Duplexes
-
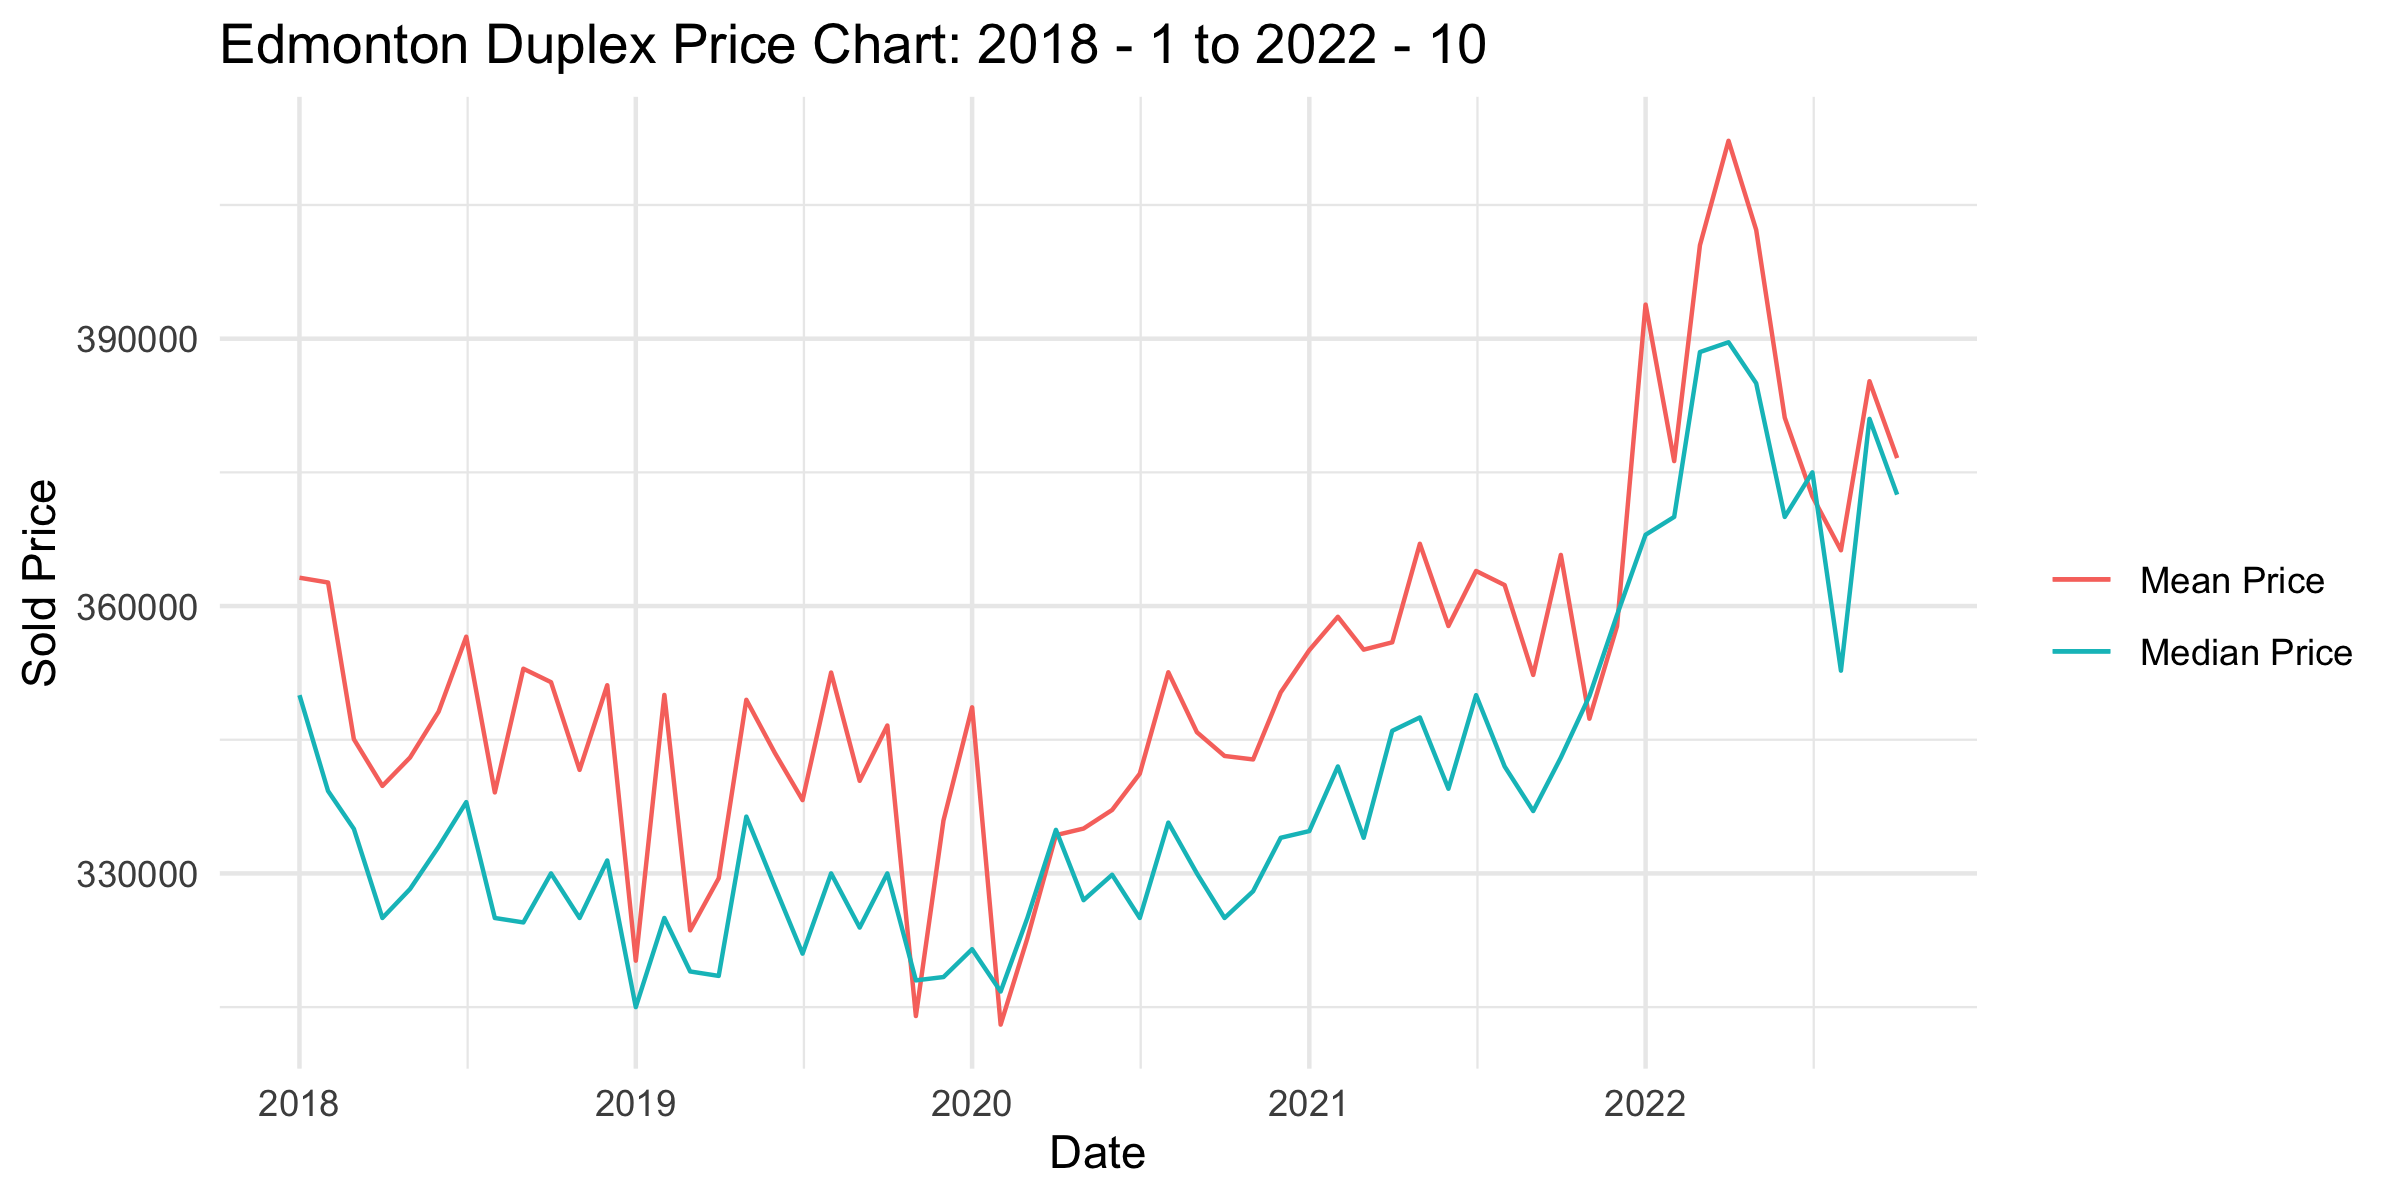
Month-over-month change: -2.2%. Half Duplexes in the Edmonton real estate market have seen a decrease of 2% in mean prices month-over-month, from $385,225 to $376,603.
-
Year-over-year change: 3.0%. The YoY price change for half duplexes rose, with a 3% increase in mean prices compared to the year before.
Townhomes
-
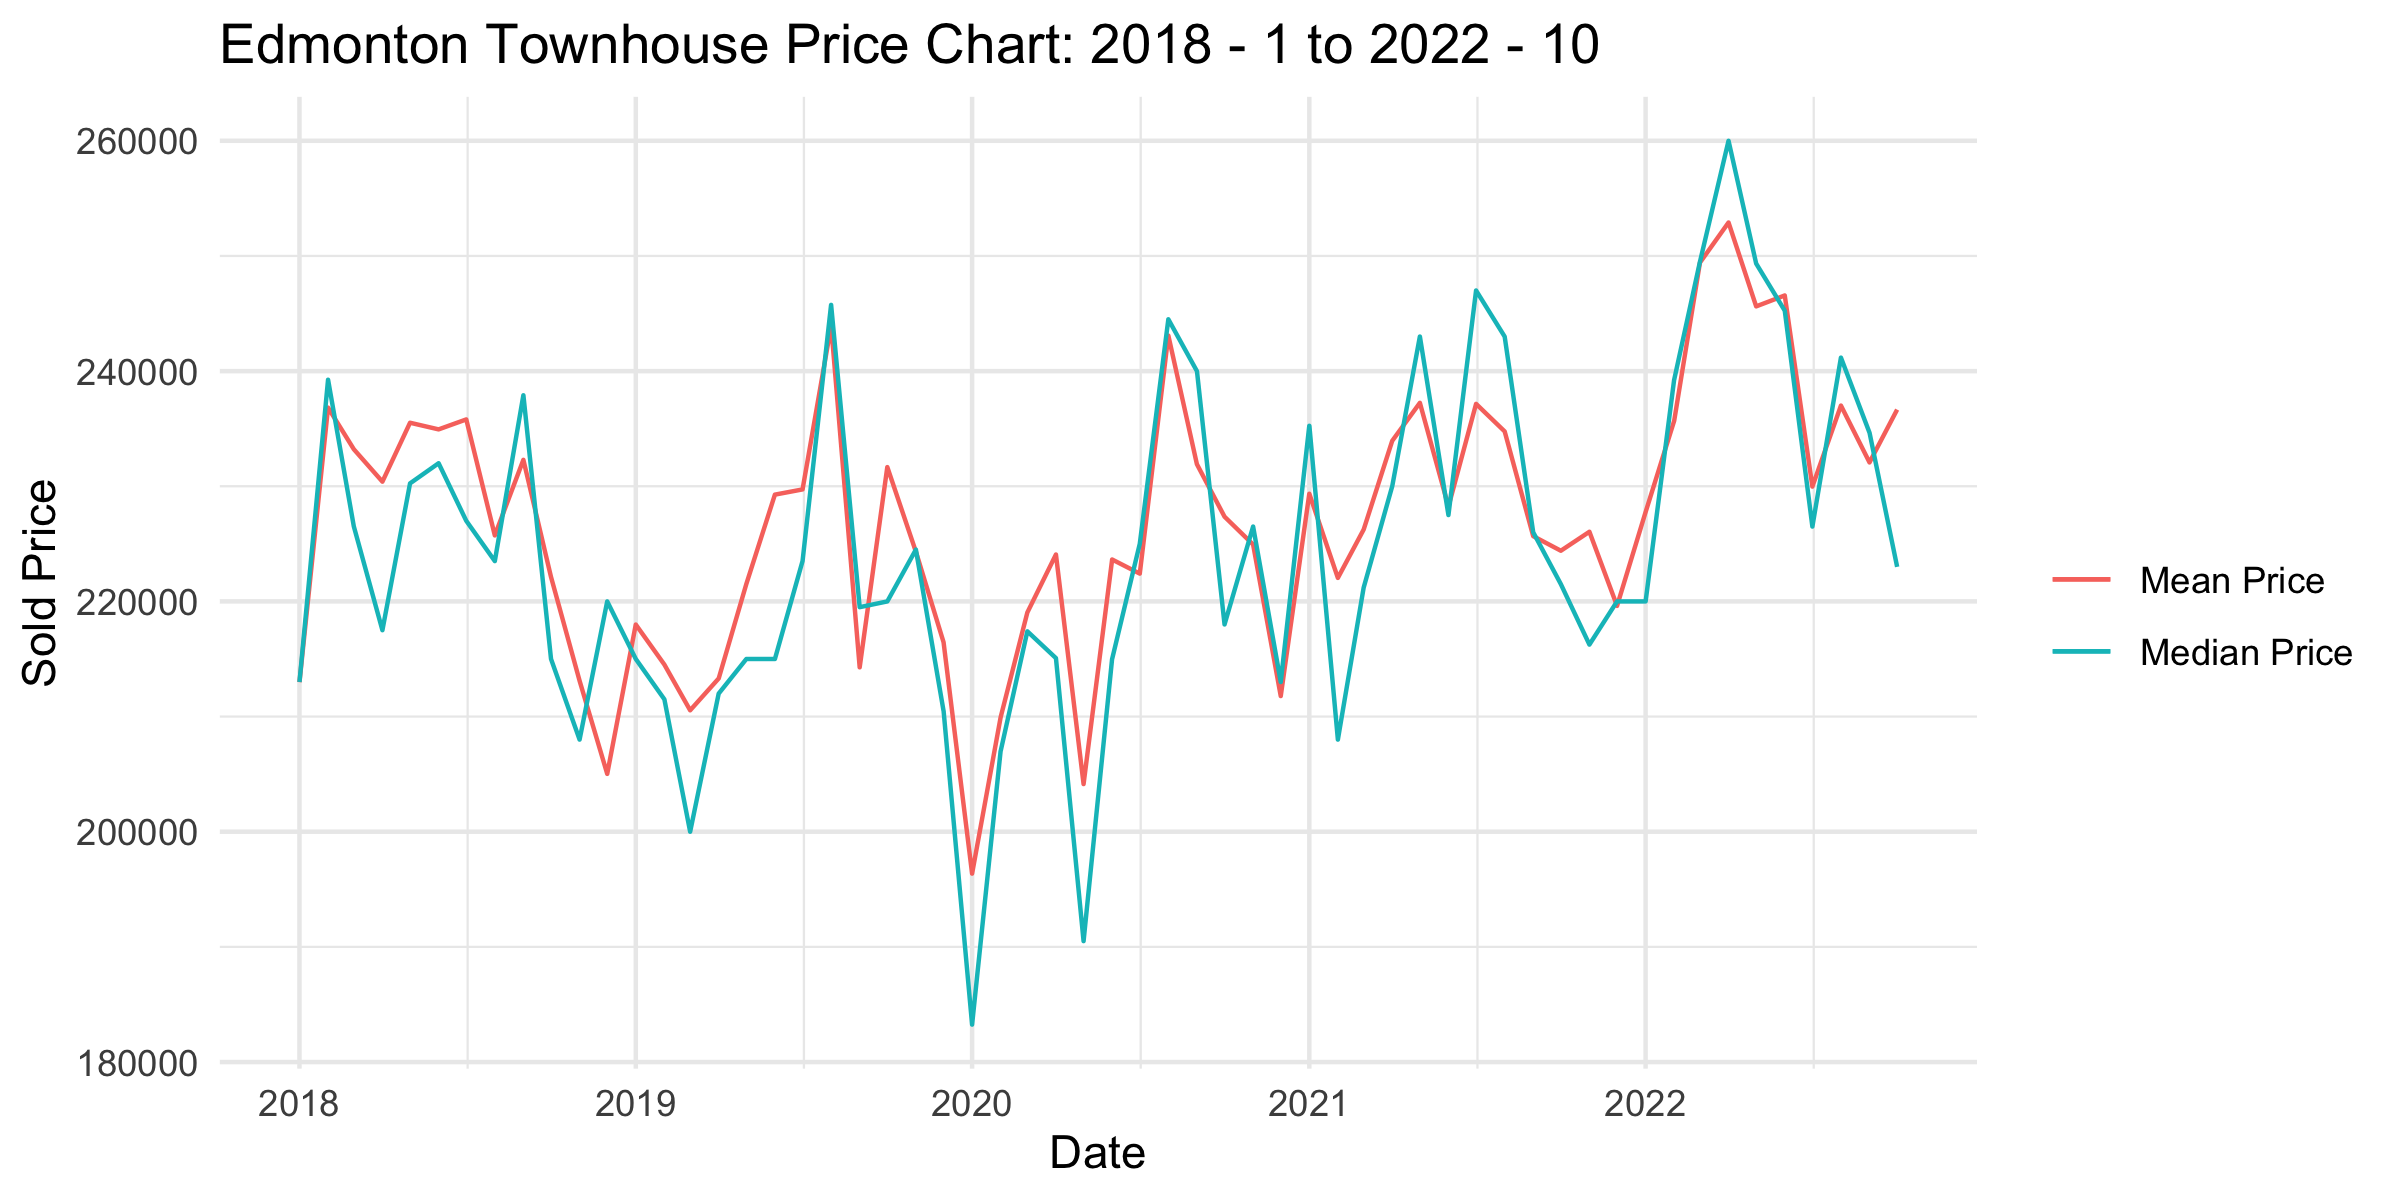
Month-over-month change: 2.0%. Mean prices rose by 2.0%, from $232,069 to $236,656.
-
Year-over-year change: 5.5%. The YoY price change for townhouses also increased, with a 5.5% increase in mean prices compared to the year before.
Condos
-
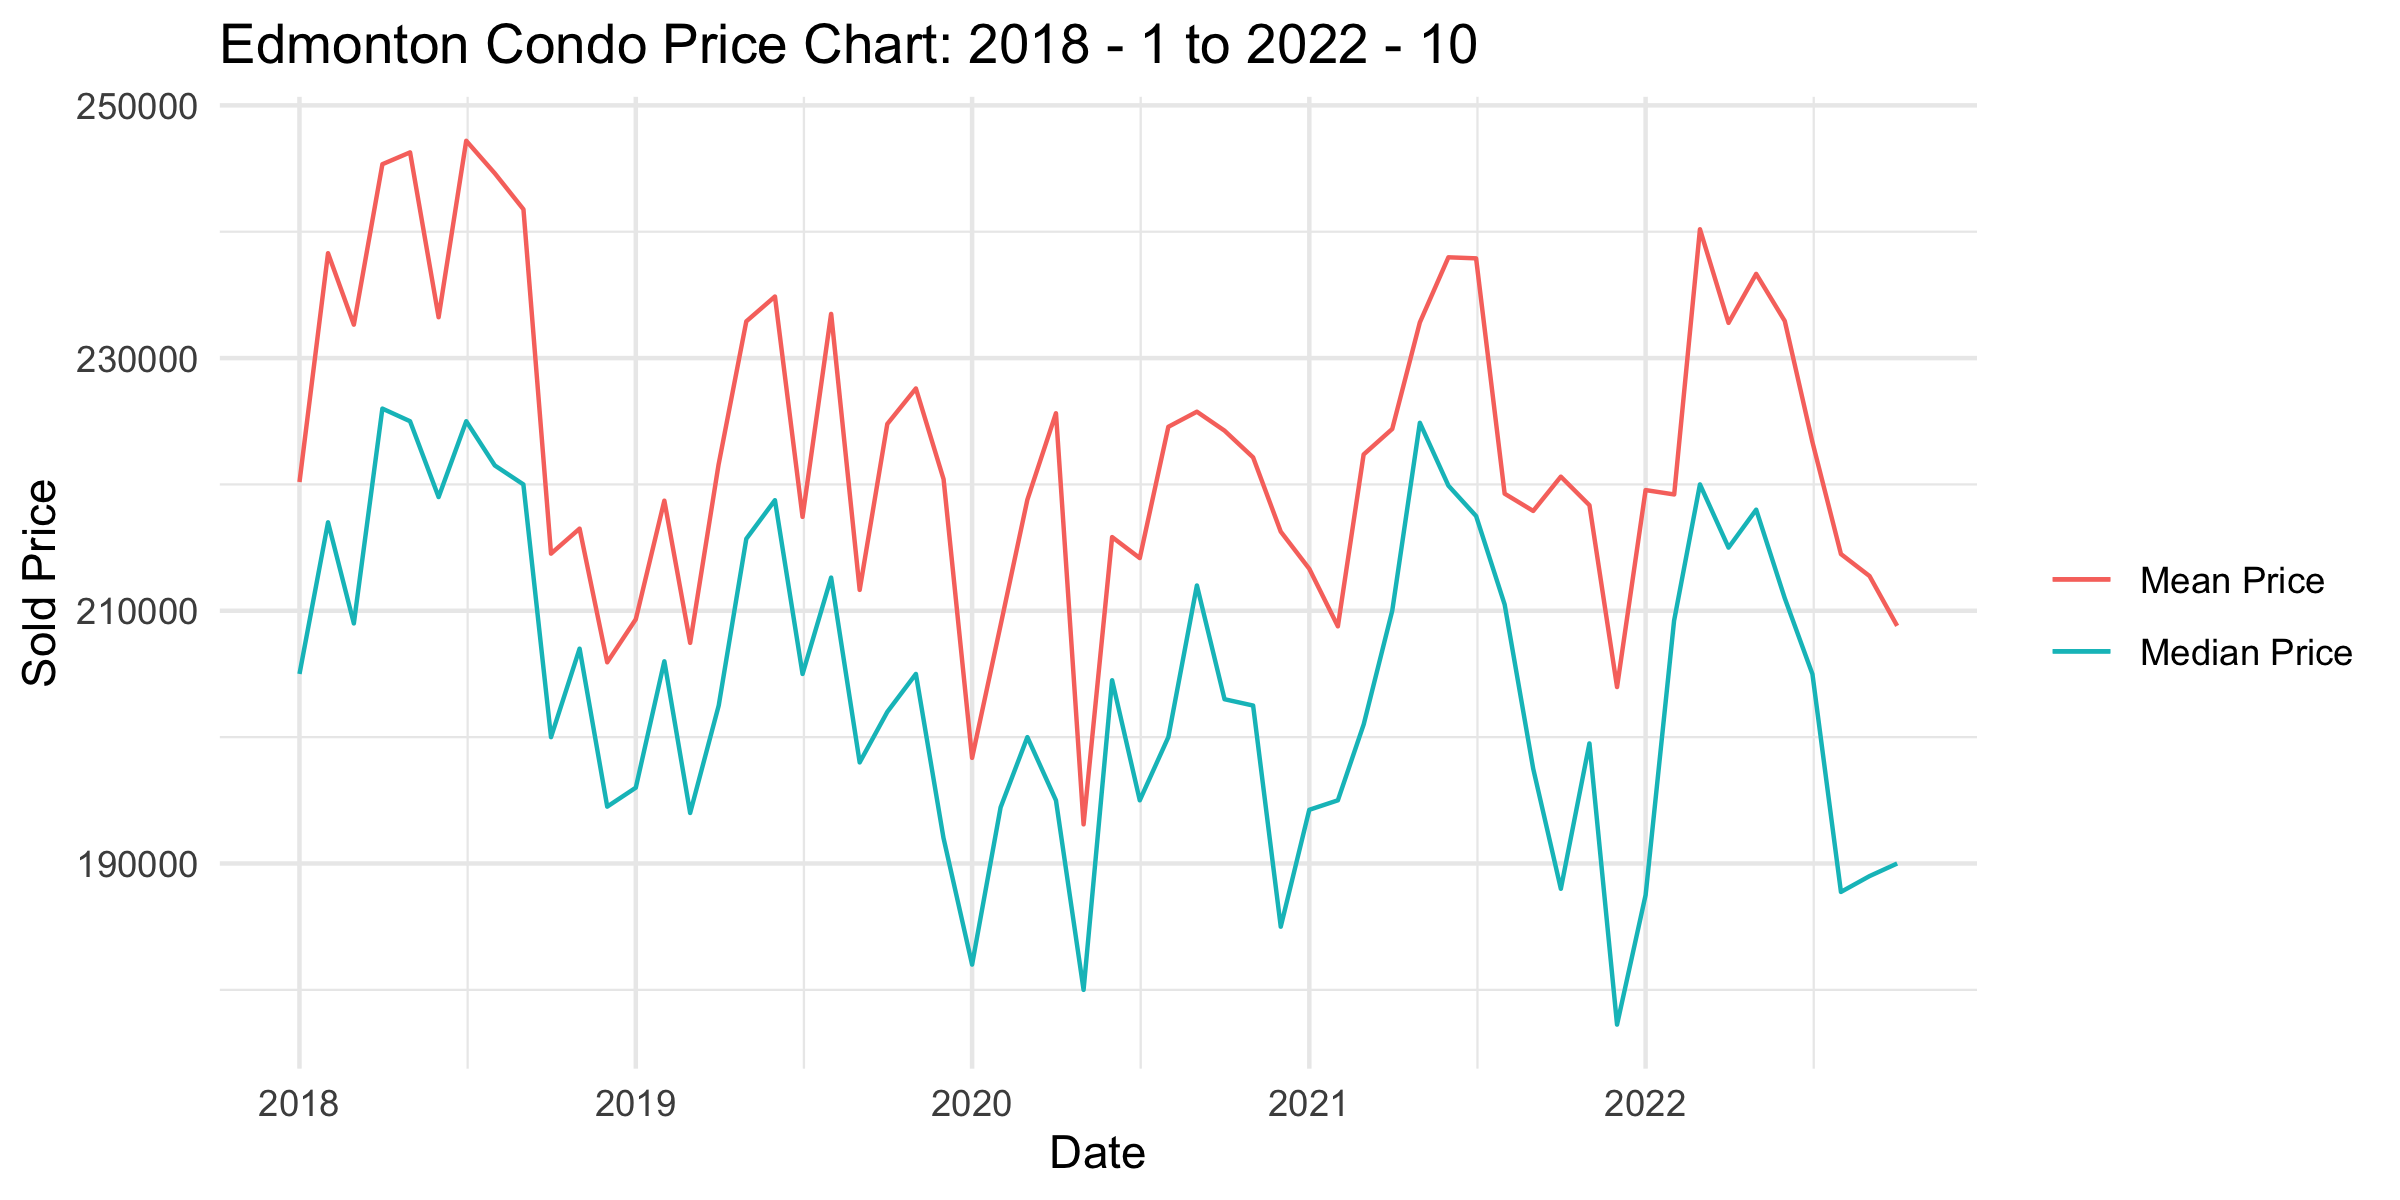
Month-over-month change: -1.85%. The mean price for condos in the Edmonton real estate market decreased by 1.85%, from $212,751 to $208,806.
-
Year-over-year change: -5.4%. Compared to the year before, condos have seen a decrease in mean prices of 5.4%.
Cumulative Days on the Market
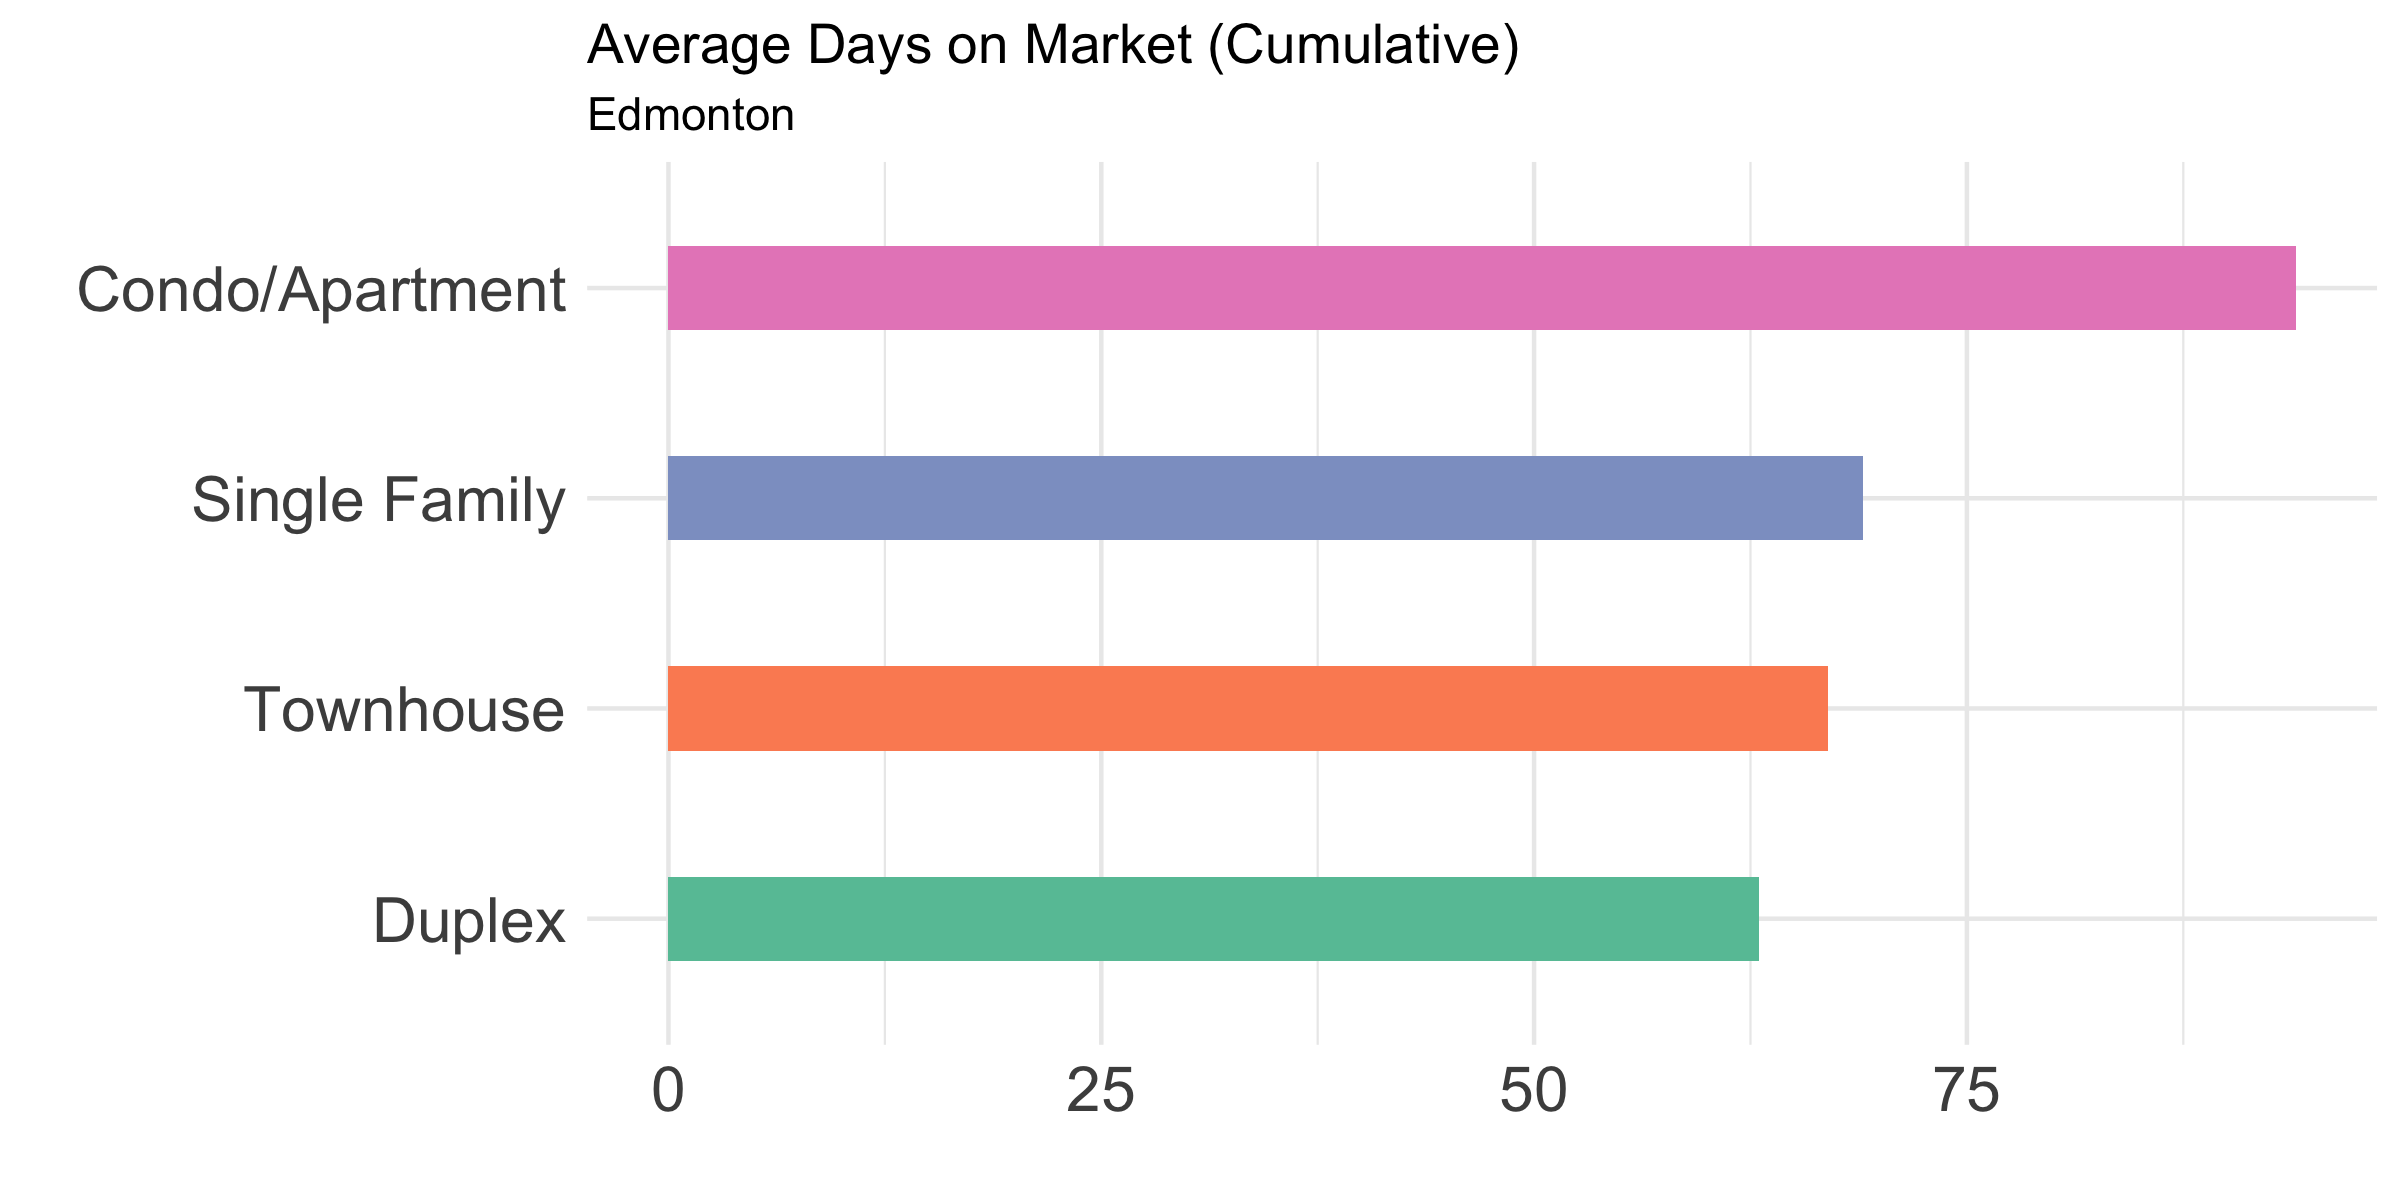
The average amount of time it took for homes in the Edmonton real estate market to sell in October was 94 days for condominiums/apartments single-family detached homes had a lower cumulative day on the market of 70, while townhomes and half duplexes had the lowest, with an average of 67 and 63 days, respectively.
New Housing Starts
September saw a 21.7% increase in housing starts from the month before, with a total of 3,423 new homes began throughout the province. This is a significant jump from the previous month.
Year-over-year, there was a 59.1% increase in starts, indicating that Alberta's construction industry is picking up pace. Approximately 42% were single-detached units and about 9% were semi-detached units. These numbers are a promising sign for the province's real estate market and economy.
Net Migration
The province of Alberta has seen a dramatic increase in net migration over the past year. In the second quarter of 2022, net migration was 34,883, compared to 1,049 in the same quarter of 2021. This is a jump of 3,225.4%. The net international migration was 25,026 while interprovincial population growth came to 9,857 people.
The Consumer Price Index (CPI)
CPI is a measure of inflation that reflects the changes in prices for various goods and services. In September 2022, the CPI in Alberta decreased by 26.1% compared to June 2022 - from 8.4% down to 6.2%.
Despite this significant drop, the CPI in Alberta and Canada remains historically high. The cost of living is still quite high, though there may be some signs of improvement as the overall inflation rate decreases.
Harsh Words from the Bank Of Canda
BofC predicts that the economy will slow down in 2023 but it should recover by 2024. The inflation will hover around 7% in the final quarter of 2022, fall to 3 percent by the end of next year, and then return to 2% towards the end of 2024.
Conclusion
The data shows that there has been a decrease in demand for homes, as well as a decrease in prices. Both sellers and buyers are erring on the side of caution. Despite this volatility, there are some positive signs for the future, with an increase in net migration and construction starts.
Whether these trends will continue to be positive in the coming months remains to be seen, but it is clear that the real estate market in Alberta is still an important and dynamic component of the overall economy. As such, investors and homebuyers alike should remain attuned to the latest market trends and prepare accordingly.
.png)