.png)

The Edmonton housing market didn't just slow in November; it contracted with precision. New listings dropped 31.4% month-over-month. Sales fell 19.5%. Yet prices? They climbed.
The November Numbers That Tell Two Stories
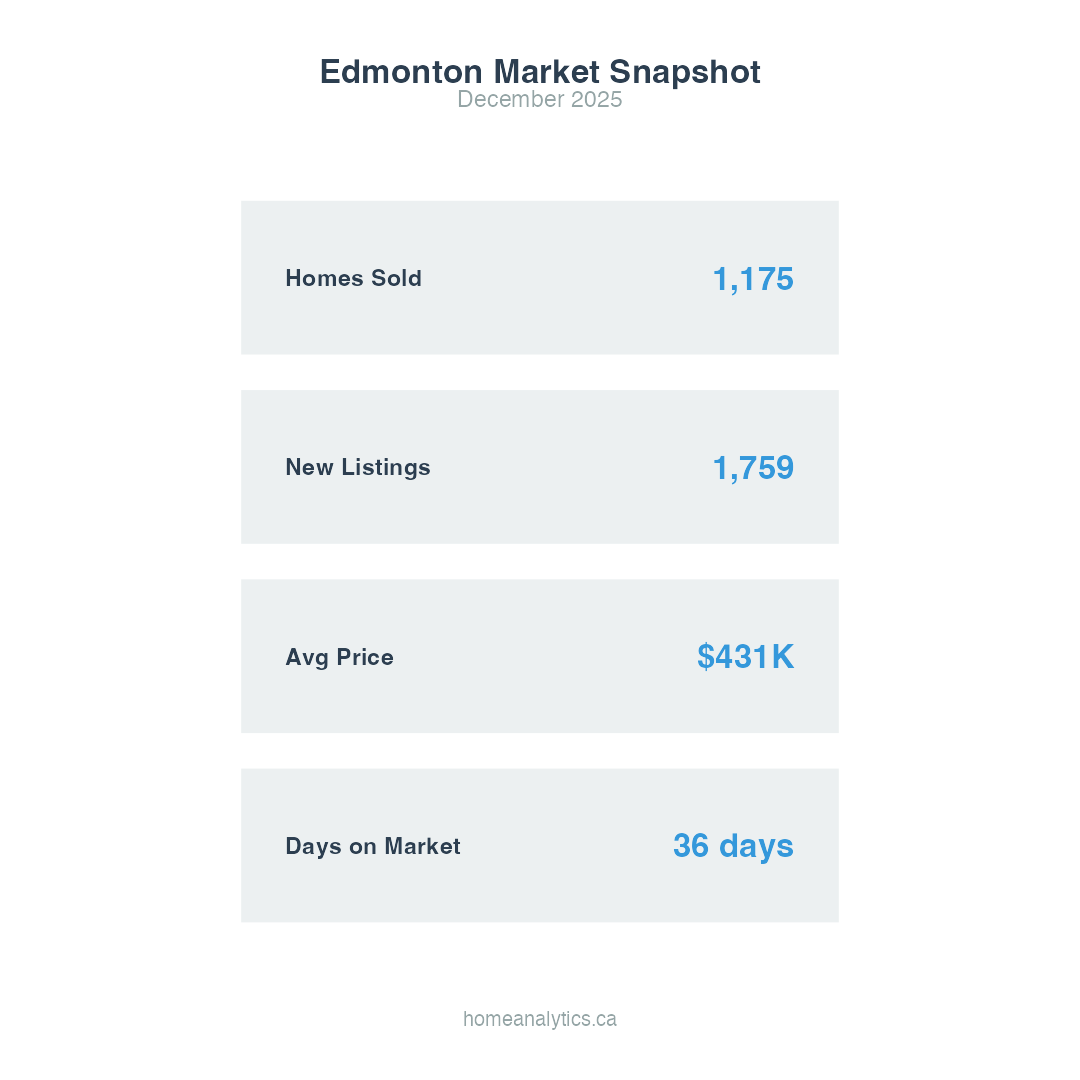
1,759 new listings were added to the Edmonton real estate market in November, a sharp 31.4% decline from October's flood of inventory. Sales followed the same trajectory, falling 19.5% to 1,175 transactions. Year-over-year, the sales story darkens further: down 12.6% compared to November 2024.
But here's where the narrative fractures: single-family detached homes averaged $548,435 in November, up 0.9% from October and 4.6% higher than a year ago. The median price climbed even faster, up 2% month-over-month to $505,000, and 3.1% year-over-year.
Less activity. Higher prices. The market is speaking in contradictions that aren't contradictions at all.
What a Sales-to-Listings Ratio of 0.67 Actually Means
The November sales-to-listings ratio landed at 0.67, firmly in seller's market territory. Any ratio above 0.60 signals seller advantage. At 0.67, buyers are operating in a market where hesitation costs them the home.
This ratio gives a direct measure of buyer strength and helps you decide how to position your home if you plan to sell.

Property Type Performance: The Winners and the Wounded
The November data reveals sharp divergence across property categories.
Condominiums Lead Price Growth
Condominiums posted a decent price appreciation, averaging $202,662, up 3.7% from October and 10.6% year-over-year. The median condo price reached $184,000, rising 1.9% month-over-month and 4.4% annually. Despite spending the longest time on market at 76 days, condos are capturing value in a market where affordability matters.
Half-Duplexes Hold Steady
Half-duplexes averaged $436,126 in November, edging up 0.4% from October and 4.1% from last year. The median price of $426,000 climbed 0.6 percent month-over-month and 5.2 percent year-over-year. These properties moved faster than condos, averaging 55 days on market, and continue attracting buyers seeking middle-ground affordability with detached-style living.
Townhouses Stumble
Townhouses took the hardest hit in November. Average prices fell 3.9 percent month-over-month to $268,766, and dropped 1% year-over-year. The median price declined even more sharply and is down 8.4% from October to $262,000, and 6.4% from November 2024.
Despite this price pressure, townhouses moved the fastest of any category, averaging just 51 days on market. The speed suggests pricing adjustments are working to clear inventory.
Single-Family Detached: The Market Anchor
Detached homes spent 61 days on market in November which is slower than townhouses and duplexes, but still commanding the highest prices and demonstrating the most consistent appreciation. At $548,435 average and $505,000 median, these properties continue defining Edmonton's upper-tier market strength.

The Seasonal Slowdown That Isn't Just Seasonal
November's 31.4% drop in new listings marks the seasonal slowdown experienced in fall and winter. But the 19.5% decline in sales, combined with persistent price growth, reveals something deeper.
Sellers are pulling back faster than buyers. This creates the inverse of what typically drives a slowdown: tightening supply rather than evaporating demand. In a normal seasonal contraction, both supply and demand fade proportionally, and prices stabilize or soften. In November 2025, supply collapsed while demand — though diminished — remained strong enough to support price increases across most categories.
The 12-month absorption rate of 57.7% tells the broader story: Edmonton's market remains active even as transaction counts fall.
Year-Over-Year Decline Meets Month-Over-Month Appreciation
Sales fell 12.6% year-over-year, yet prices climbed 4.6% for detached homes.
Fewer transactions don't mean lower prices when supply contracts faster than demand. The November sales-to-listings ratio of 0.67 confirms this: for every 100 homes listed, 67 sold.
The 12-month total tells the scale: 31,167 new listings, 17,987 sales. Over the full year, the absorption rate landed at 57.7 percent which is healthy, consistent, and far from distressed.

The Price-to-List Ratio That Shows How Buyers Behave
Buyers paid a median of 98 percent of list price in November, and 12.8 percent of transactions closed above list. This shows a market where buyers respond fast when a home is priced well. Homes are not sitting because of negotiation gaps. They sit when pricing ignores current supply pressure.
Buyers remain engaged, selective, and willing to pay near-full price when a listing meets their expectations.
Conclusion
Your November data shows a market shaped by tight supply, selective demand, and price resilience across most property types.
New listings dropped faster than sales, yet prices pushed higher, supported by a sales-to-listings ratio of 0.67 and strong price-to-list performance.
This is the environment you face as you prepare for 2026: fewer listings, committed buyers, faster absorption when pricing aligns with demand, and a spring market set to open with less inventory than last year.
Internal Resources for Further Reading
Read about selling costs here: How Much Does It Cost to Sell Your House in Alberta in 2025
For a deeper dive into seasonal timing: What’s the Best Month to Sell a House in Edmonton – Seasonal Trends Based
Explore current listings of homes: Single Family Homes For Sale and Half-Duplex For Sale Edmonton Latest MLS Listings
If you'd like a breakdown of neighbourhood-by-neighbourhood house prices in Edmonton, or a guide on how to estimate your property value by address, reach out to us using the link below!