
September brought more changes to the Edmonton market, with listings down and buyer activity below its usual pace.
Supply and Inventory
September continued the trend of fewer new listings hitting the market, with 1,869 homes listed, down 33.6% from August.
September saw 1,869 new listings, fewer than the 2,816 recorded in August.
Demand and Sales Volume
Total residential sales in Edmonton came in at 1,079 for September, down 26.0% from September 2025 and 23.8% lower than August.
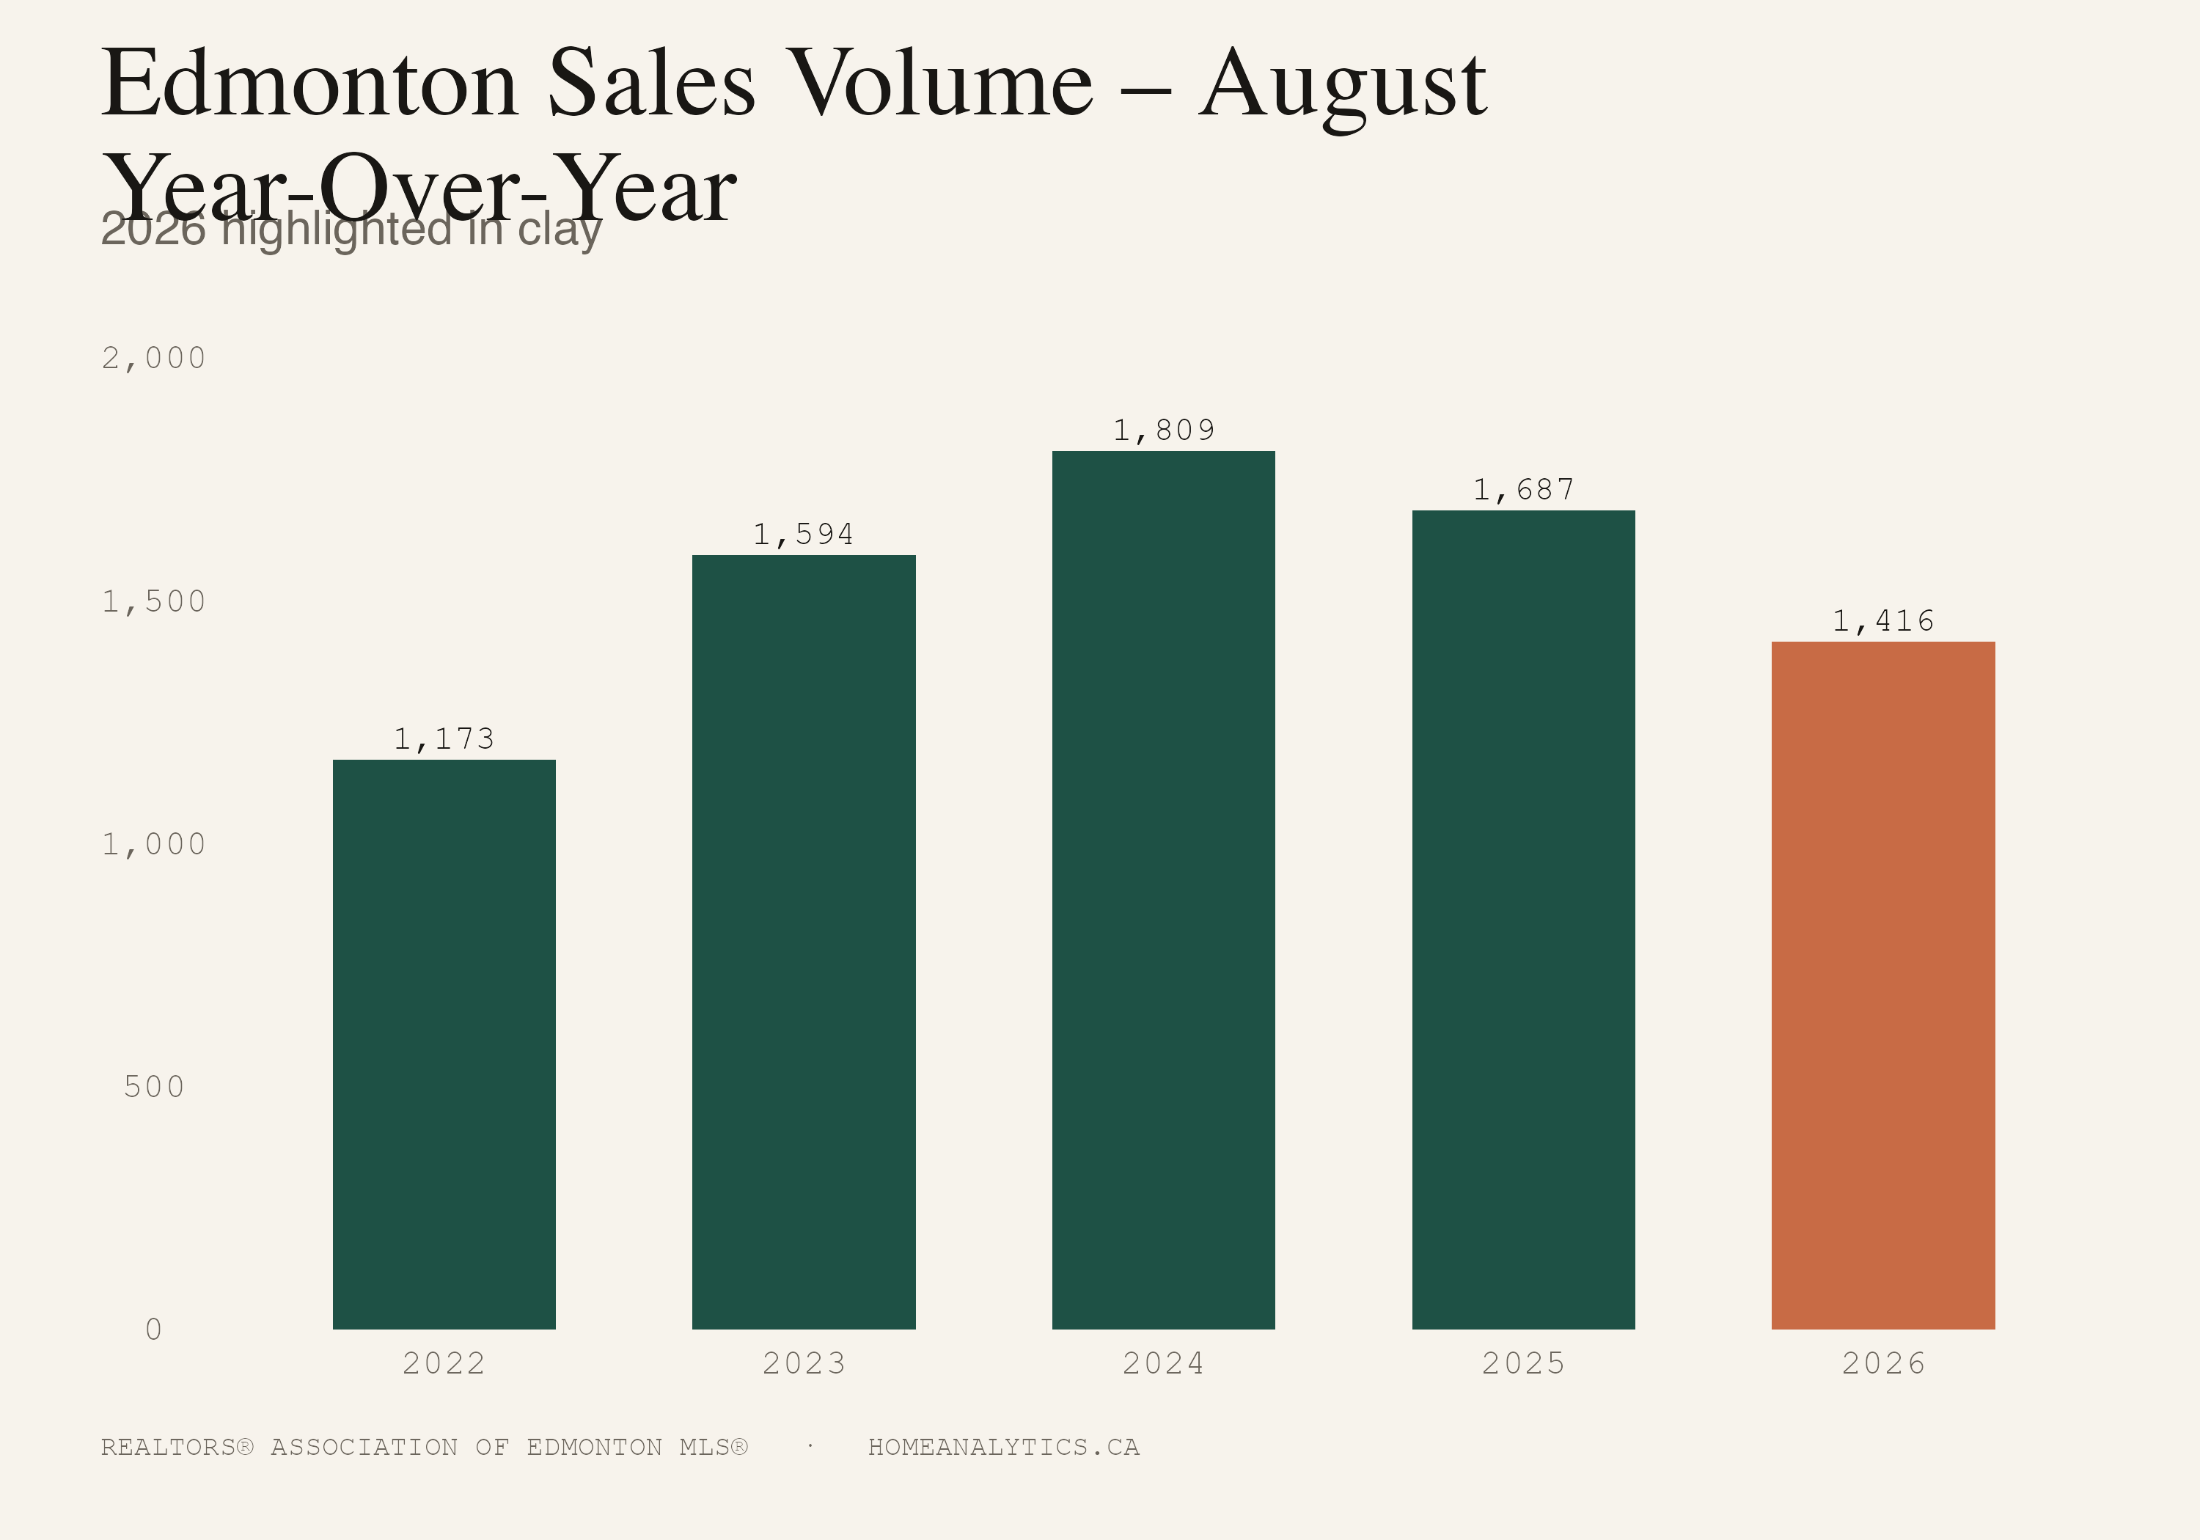
A total of 1,079 homes sold in September, down from 1,416 in August.
The Edmonton sales-to-new-listings ratio came in at 0.58 for September, which puts us in balanced market territory.
Days on Market and Velocity
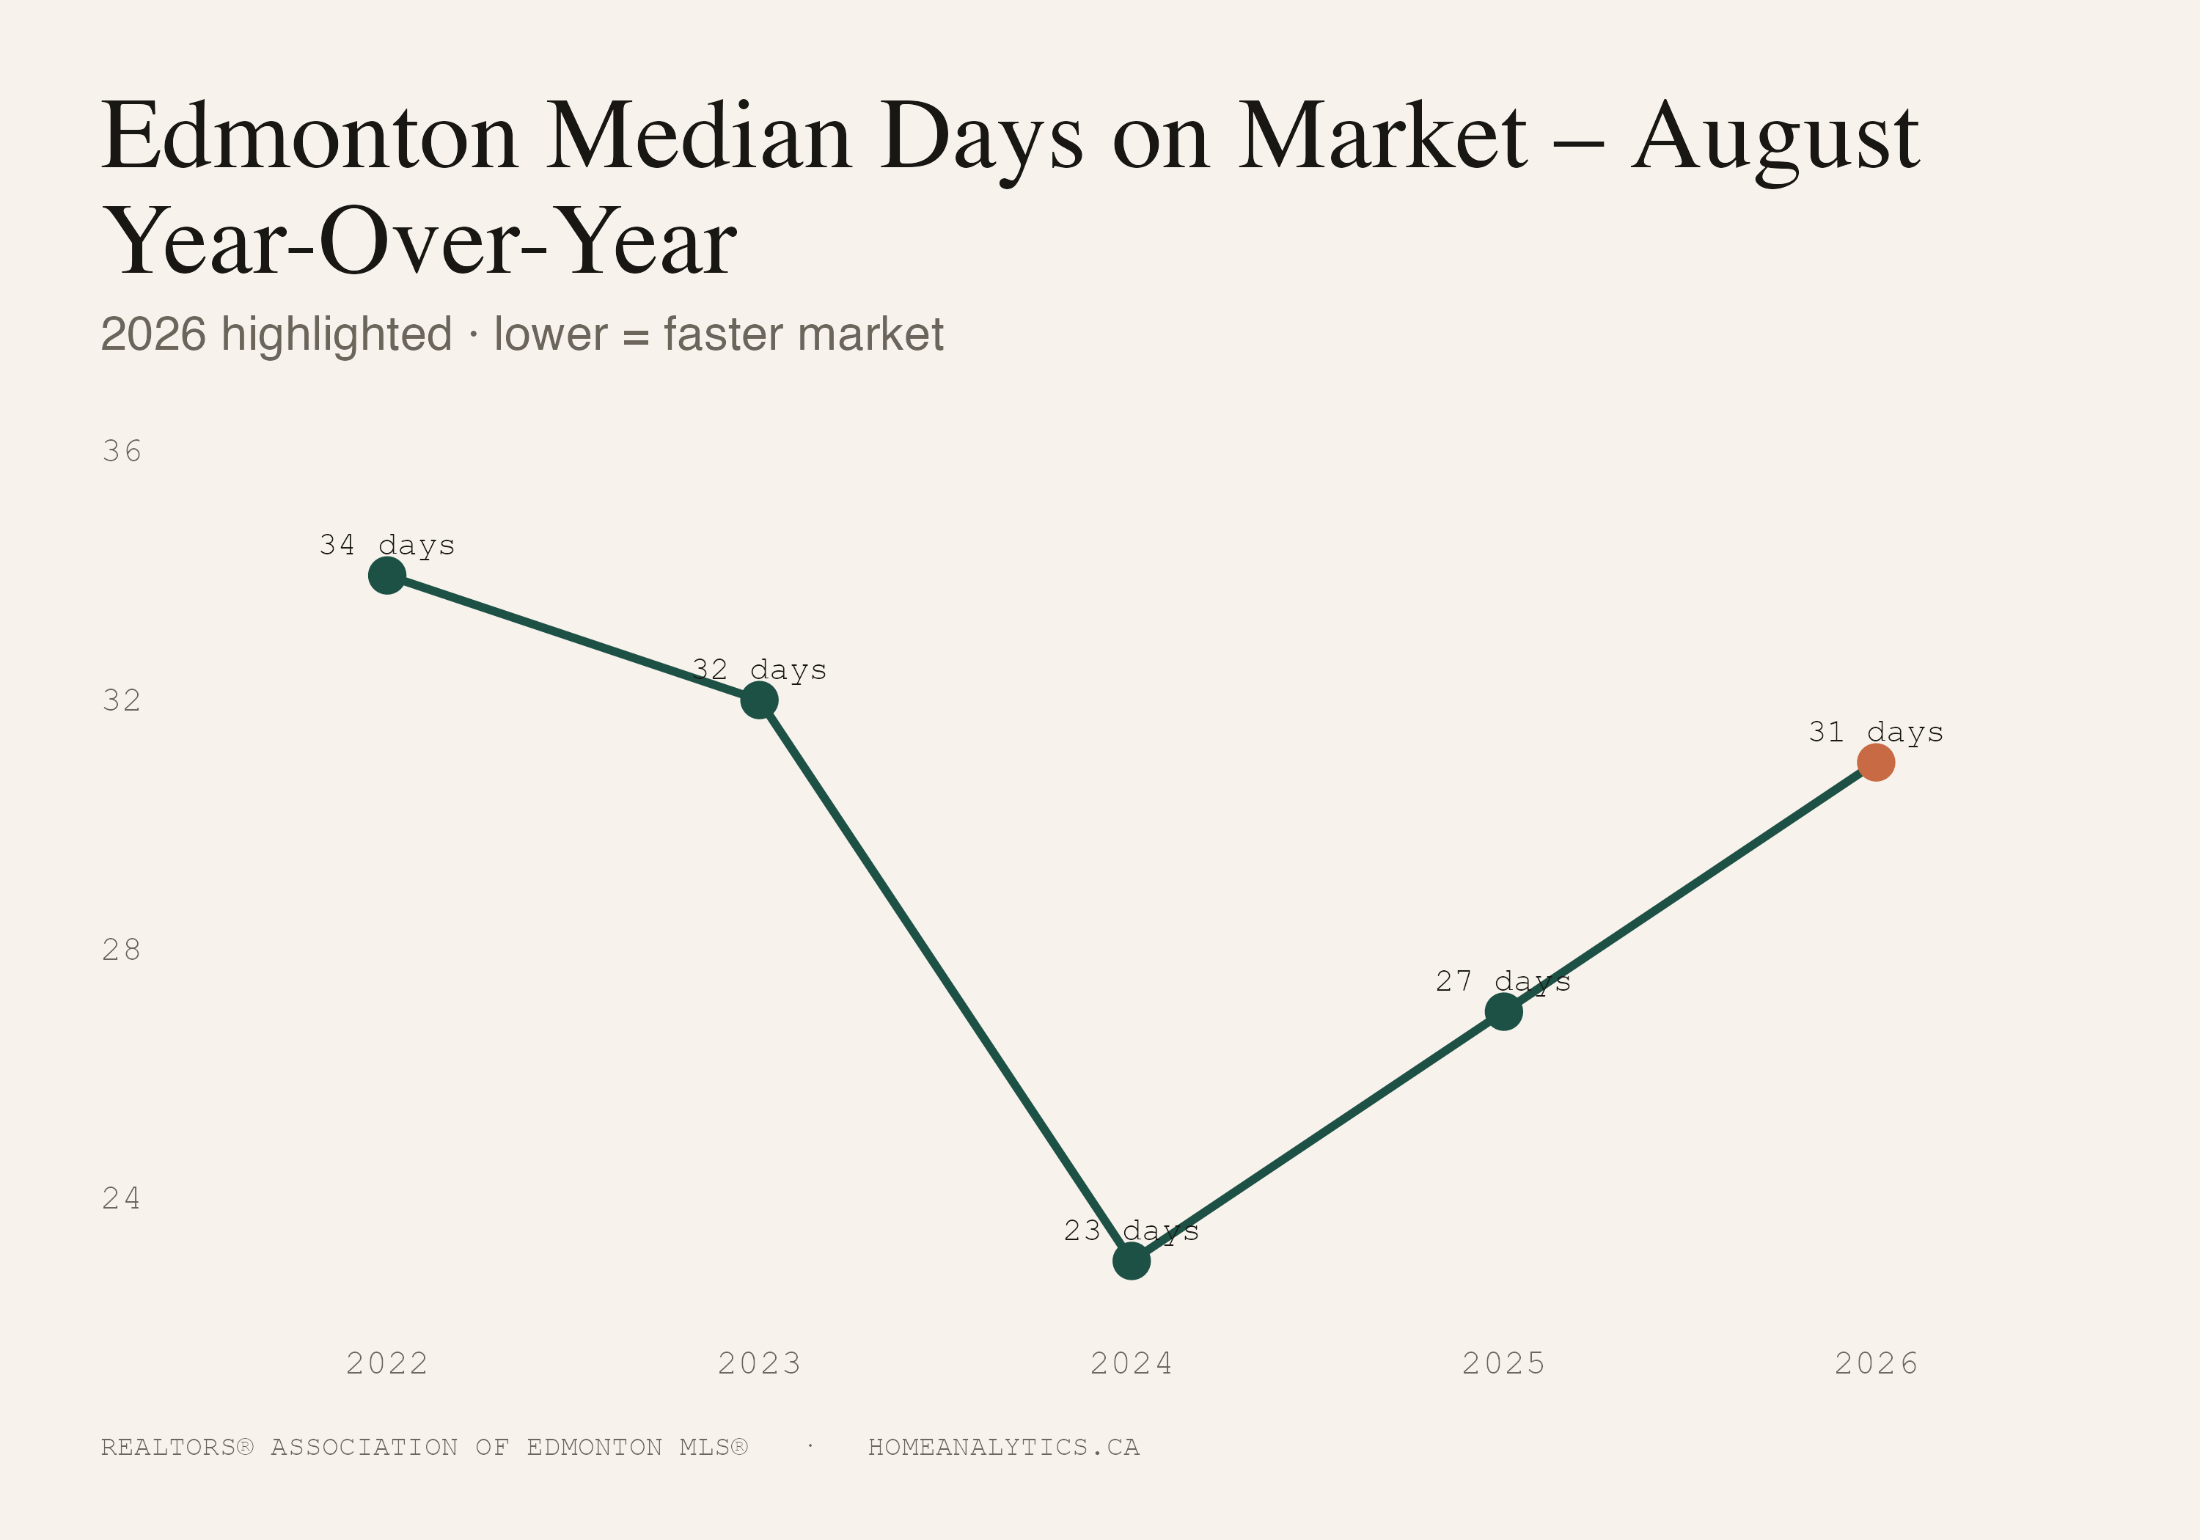
Median days on market increased to 35 days, indicating that sold properties generally took longer to find a buyer.
The typical selling period lengthened from 31 to 35 days.
42.4% of sold properties sold within 30 days, down from 49% in the previous period.
Detached homes spent 60 cumulative days on market, while duplexes took 73 days and condos 87 days. Townhomes spent 71 days and residential attached homes 74 days.
Single-Family Detached Prices
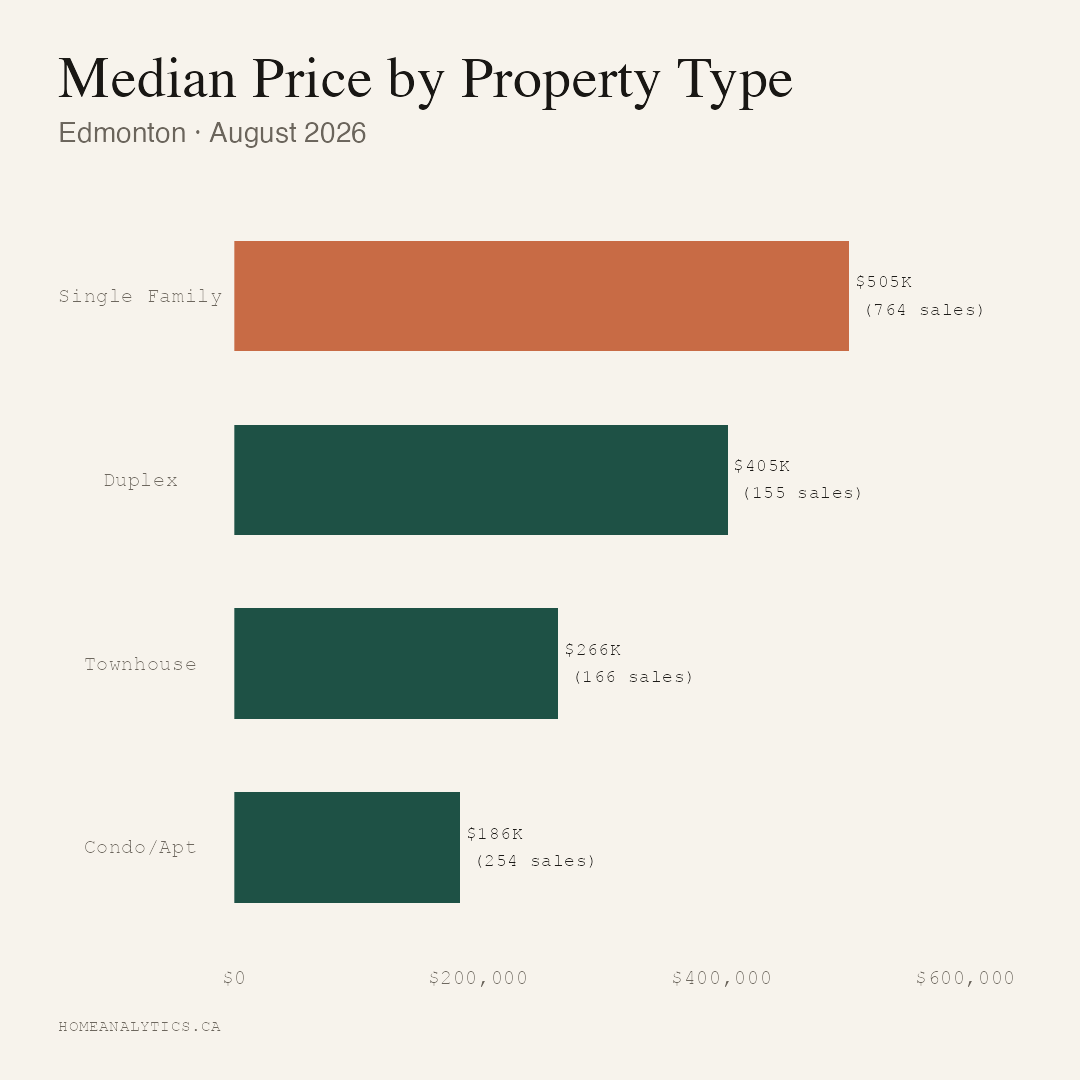
Single-family homes averaged $426,699, a 20.9% year-over-year decline and 23.4% lower than August.
The median single-family price fell 11.3% year over year to $440,000.
The midpoint sale price for detached homes declined 12.8% month over month, indicating a lower median transaction price.
The average SFD price was $426,699, while the median stood at $440,000, providing two perspectives on the distribution of sold prices.
Average and median prices both declined, indicating lower mean and midpoint transaction prices compared with August and with September 2025.
Half-Duplex Prices
Half-duplexes averaged $398,792, 10.5% lower than last year; month over month the price fell 3.8%.
The median half-duplex price declined to $400,000, placing the midpoint of transactions below the previous period's level.
Median half-duplex prices declined 1.2% month over month and 5.1% year over year.
The median half-duplex sold for $400,000, roughly $40,000 less than a typical detached home.
Condo and Townhome Prices
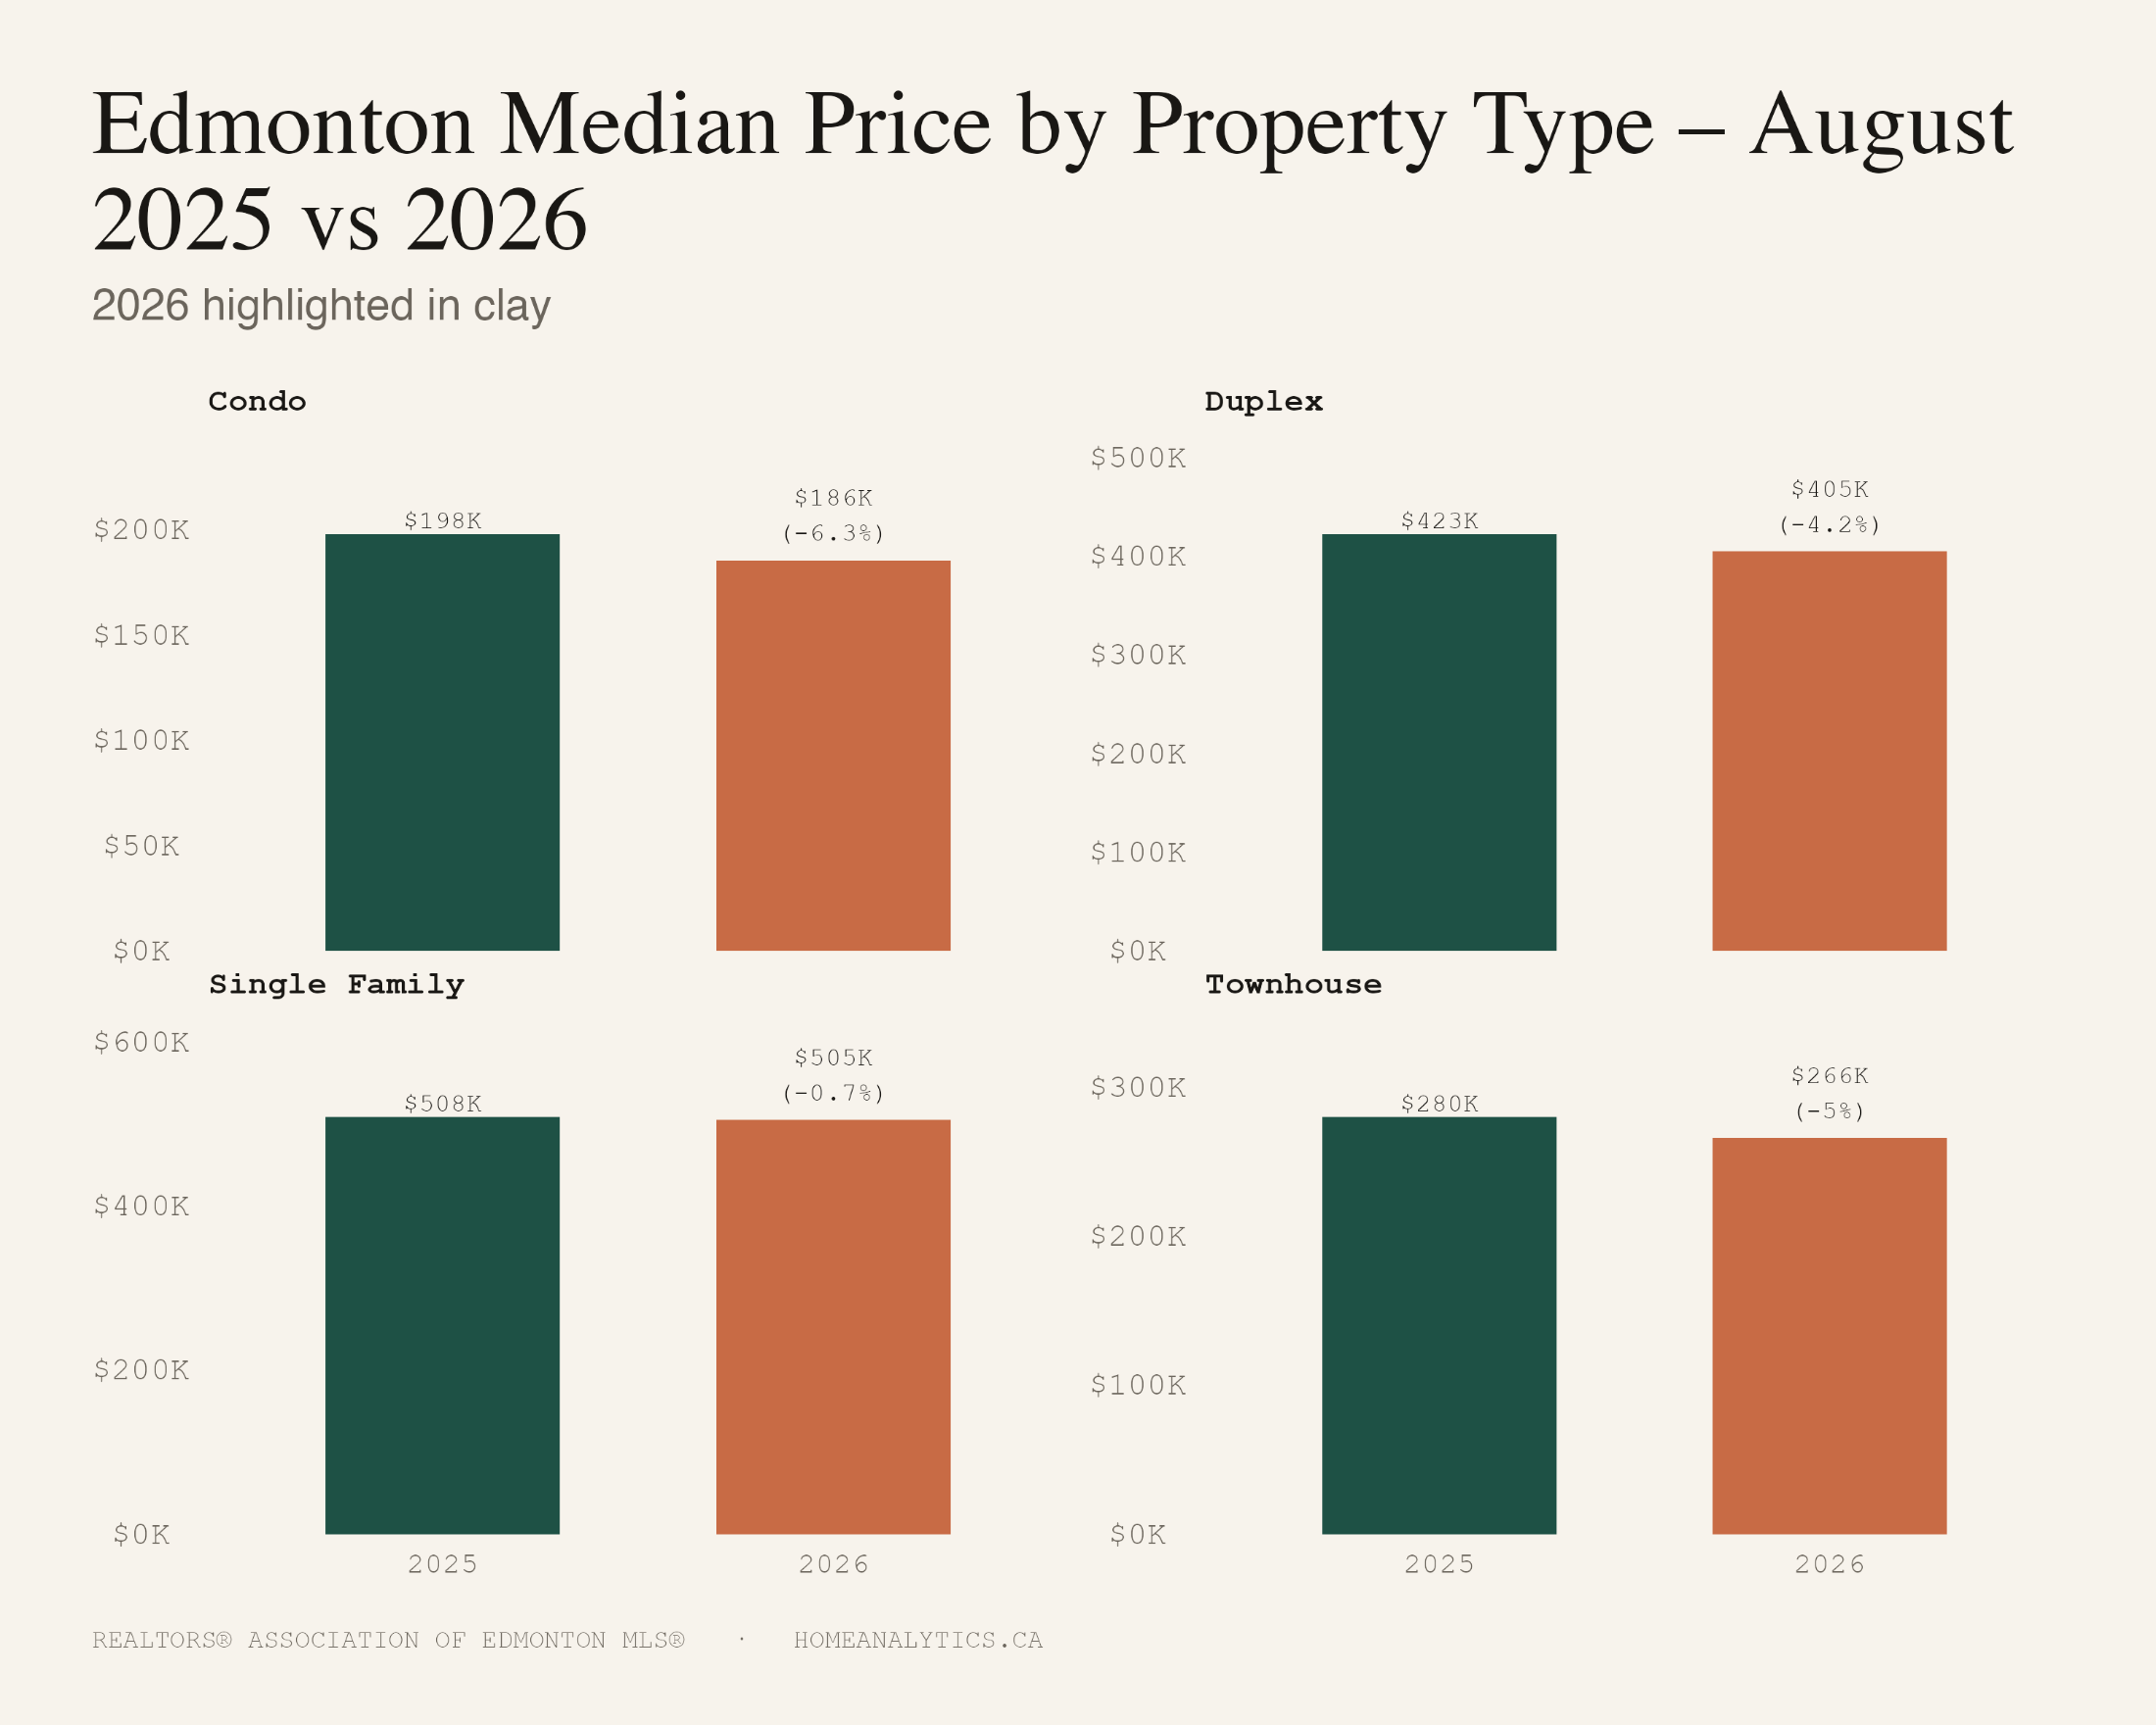
Condos and townhomes both saw single-digit month-over-month price declines of 6.5% and 5.5%, to $194,773 and $262,090.
Average condo prices declined 2.4% year over year, while average townhome prices declined 4.7% year over year.
The median condo sale price was $175,000 in September, down 5.7% month over month and 5.4% year over year.
The median townhome sale price was $253,000 in September, down 4.9% month over month and 8.0% year over year.
Sale-to-List Ratio and Market Health
The median home sold for 97% of its list price in September, so a typical seller gave up about 3% in negotiation.
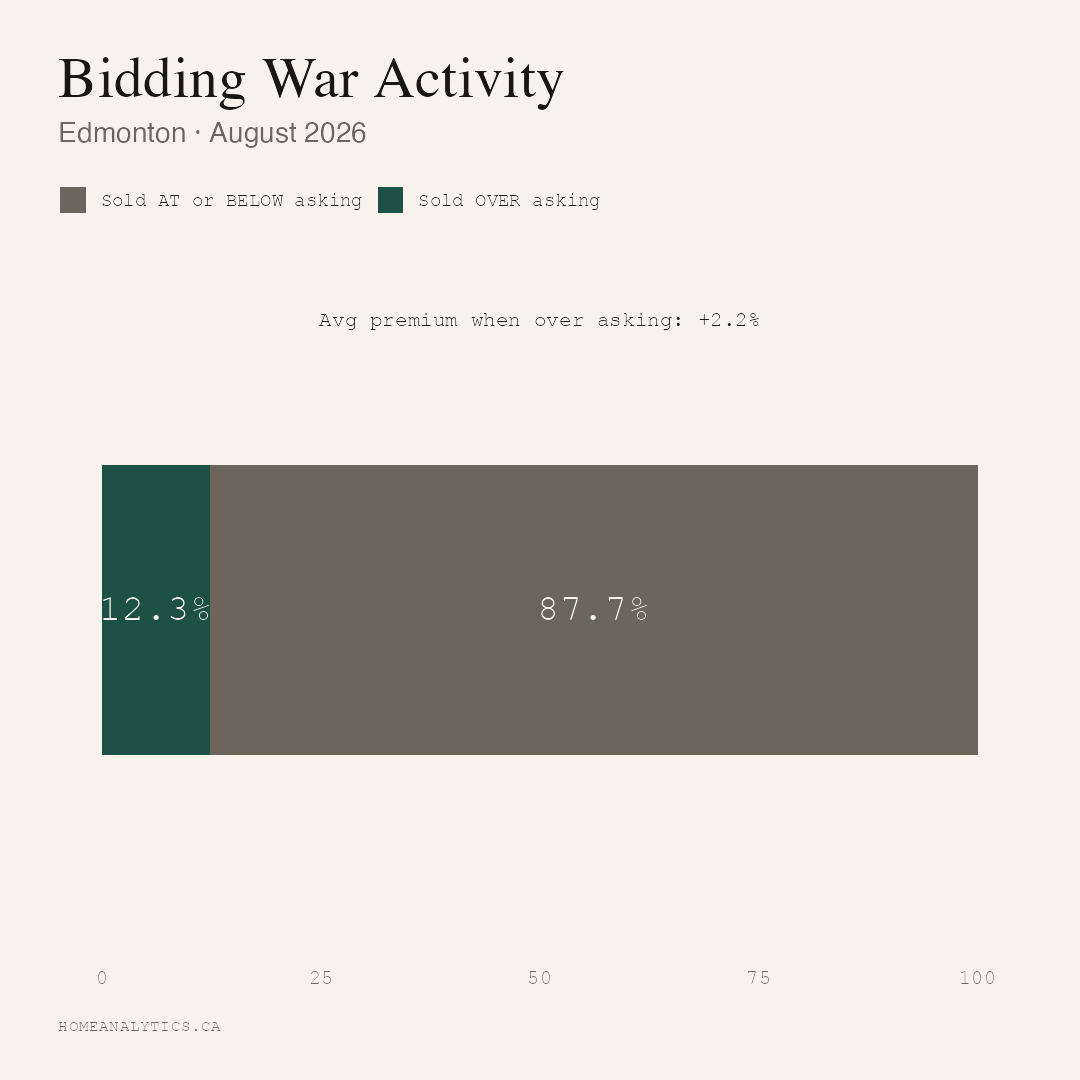
Bidding wars are less common: only 10.6% of sales closed over list price, compared with 12% last month.
The Edmonton Market Health Index came in at 81.7 for September, which puts us in strong seller's market territory. On this index, values above 50 indicate conditions favouring sellers and values below 50 favour buyers.
Conditions keep shifting depending on price range, location and property type.
Price Distribution (Past 12 Months)
The largest of the reported price bands was under $300K, representing 28.3% of transactions over the past 12 months.
Nearly half of buyers (46.8%) purchased between $400K and $750K.
Homes over $1M made up just 2.6% of sales, so fewer than 1 in 30 buyers shopped at that level.
These figures describe the distribution of completed sales and should not be read as price appreciation or depreciation.
Neighbourhood Highlights (Past 6 Months)
Edgemont had the highest median sale price at $525,000.
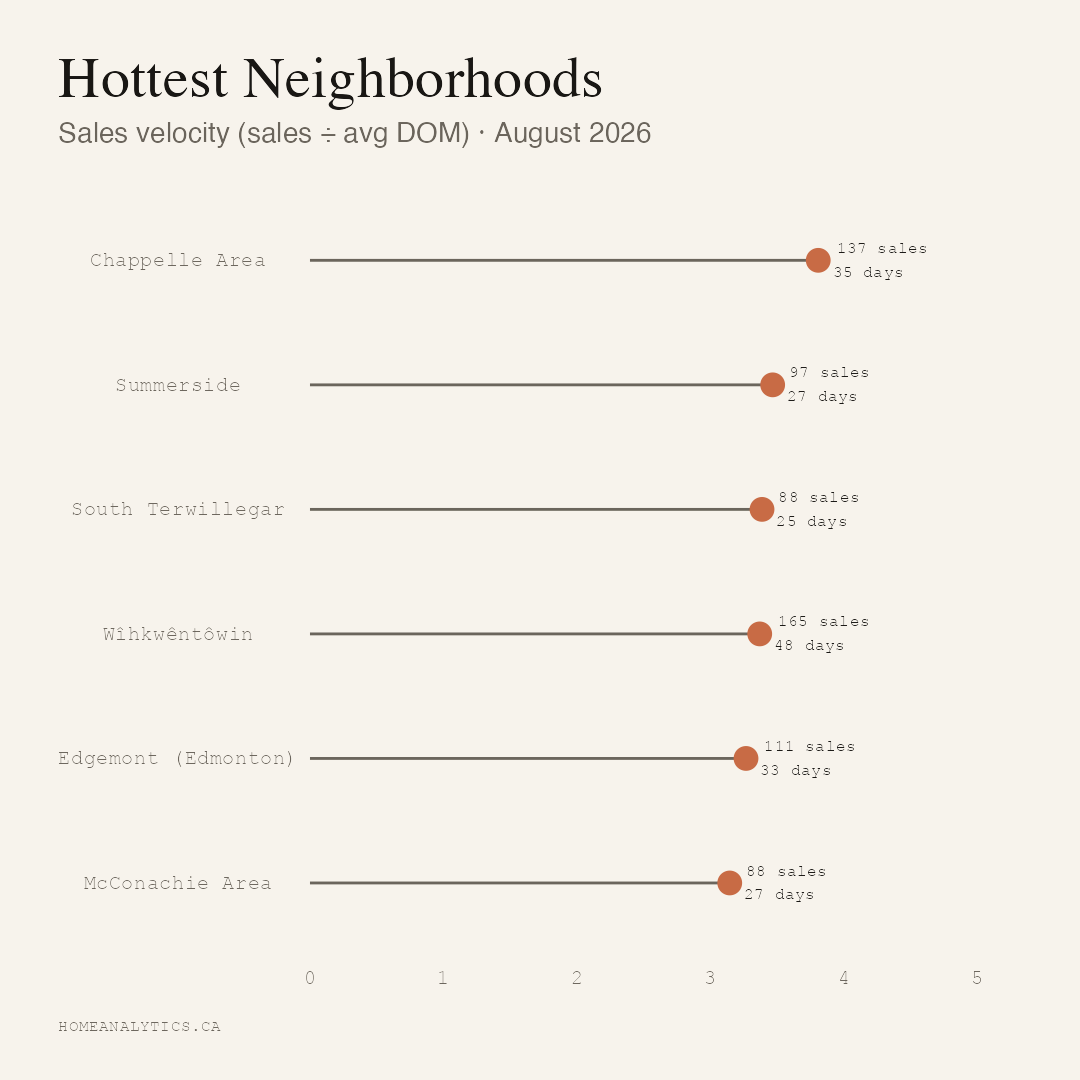
Wîhkwêntôwin was the most active area, with 202 transactions in the past 6 months, and it also offered the lowest price per square foot at $200/sq.ft.
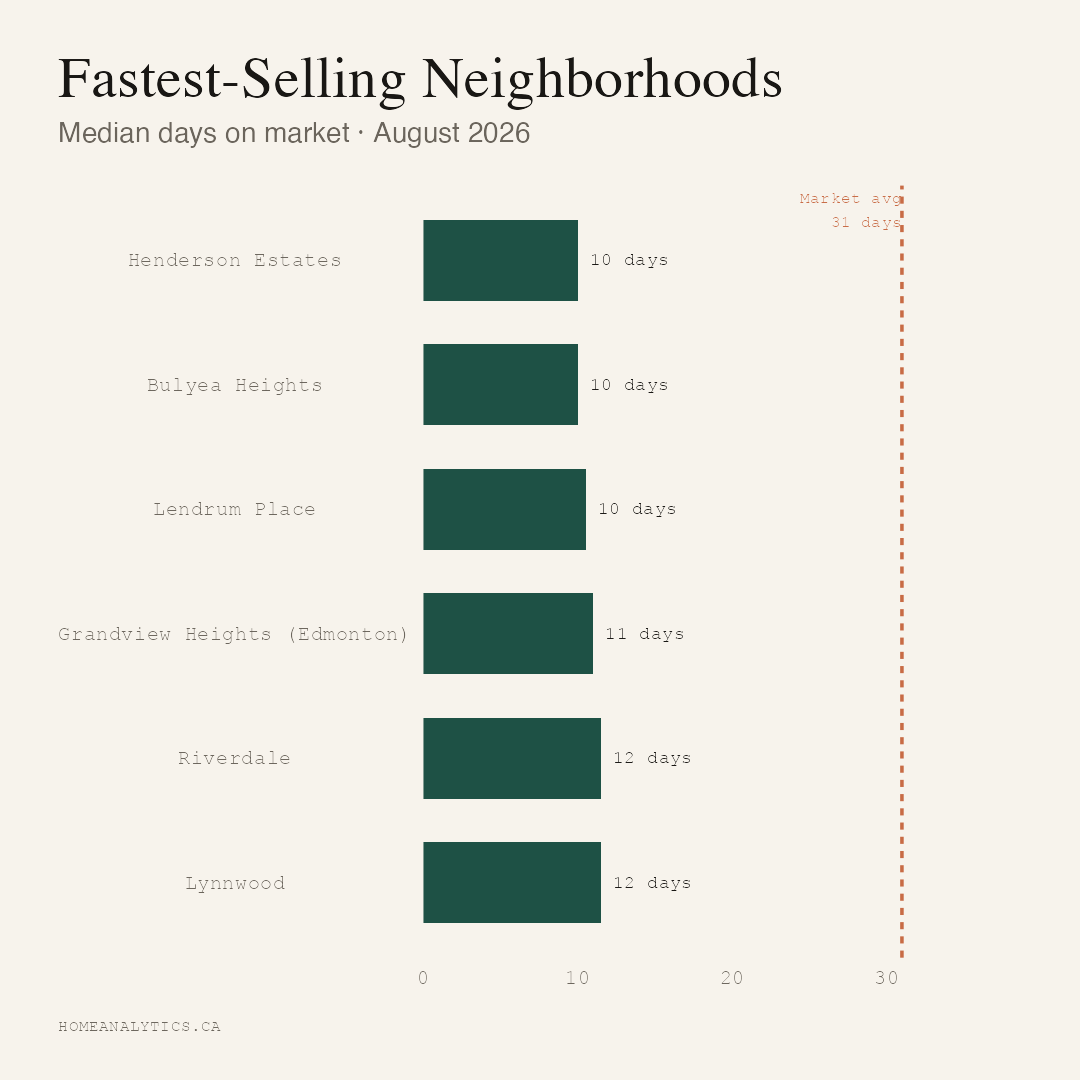
Homes in Summerside sold the quickest, with a median of just 26.5 days on market.
Seasonal Patterns
Based on historical patterns, May tends to be the most active month for home sales in Edmonton, while sales activity typically declines in December.
Year-to-Date: January to September 2026 vs 2025
Completed sales declined 10.8% from a year earlier, falling from 14,310 to 12,762 and signalling weaker annual transaction volume.
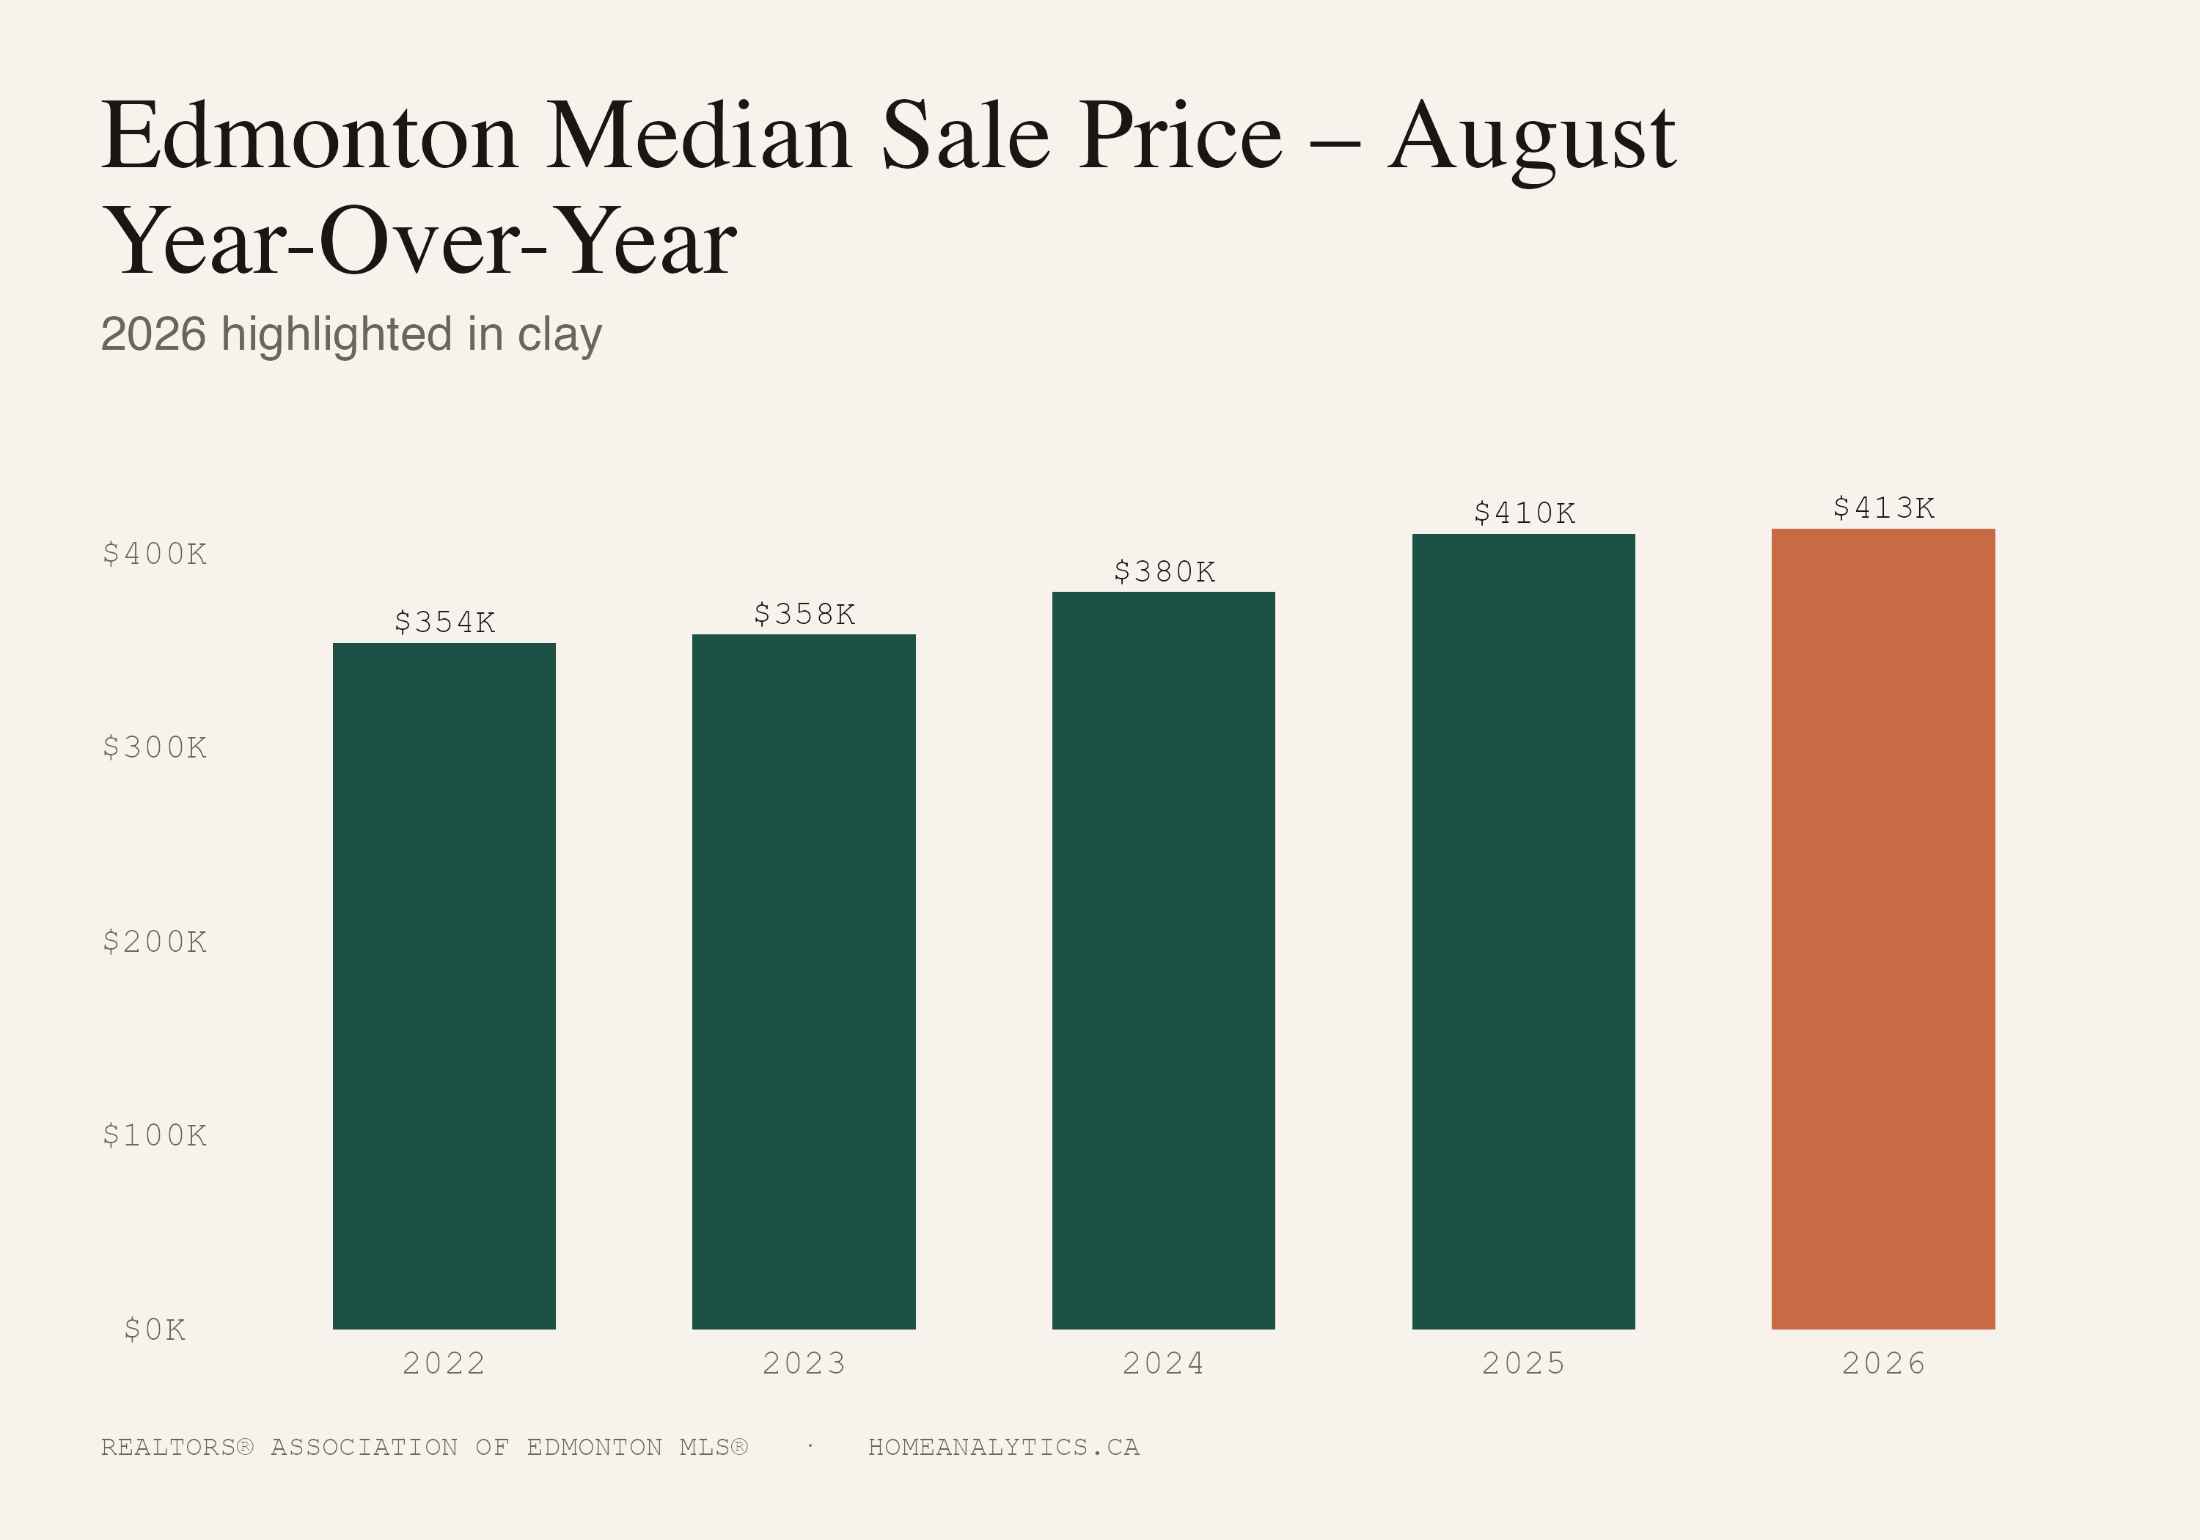
Annual price movement was modest, with the average price changing by 1.2% to $439,858, up from $434,627.
The overall median sale price remained at $415,000, unchanged from the same period last year.
The typical selling period lengthened from 35 to 42 days, a 19.9% increase in average days on market.
Total listings fell 2.7% to 25,069, down from 25,775.
The average list price was virtually unchanged at $483,127, within 0.4% of last year's $485,032.
The sales-to-listings ratio declined from 0.56 to 0.51, an 8.3% drop.
Semi-detached and townhomes both saw single-digit price declines of 3.0% and 5.3% year to date, while condos slipped 3.1% and single-family detached homes slipped 2.0%.
July posted the strongest year-over-year growth, with sales up 80.7%, while January saw sales down 31.7%.
Sales fell 21.1% in Q1 2026 compared with Q1 2025.
In 2026, the market was predominantly characterized as a balanced market for 9 months, reflecting equilibrium between supply and demand.
Market Forecast
Based on the linear trend of the past year, average single-family home prices in Edmonton are projected to increase by approximately $138,800 over the next 6 months.
By March 2027, the average price is forecast to reach $565,000, with a 95% confidence range of $556,000 to $575,000. This forecast assumes market conditions remain relatively stable.
Alberta Construction
Alberta recorded 4,576 housing starts in September, a 1.4% month-over-month decline.
Total construction value in Alberta reached $2,018,859,000 in August, up 21.7% month over month.
Bottom Line
Buyers: with 1.7 months of inventory and homes selling for 97% of list, there's still room to negotiate.
Sellers: well-priced homes are selling in about 35 days, so pricing right from day one matters.
Every price range behaves differently, so check what's happening in your own segment before you list or make an offer.