.png)
January has arrived, bringing a decisive shift to the housing market and the first real estate update of 2026.
In this recap, we'll cover recent sales and pricing trends, shifting buyer dynamics, and key insights shaping the road ahead.
What's Happening Right Now in Edmonton's Market?
Are prices going up or down? Is now a good time to buy or sell? Are homes sitting longer on the market?
Here's what you need to know:
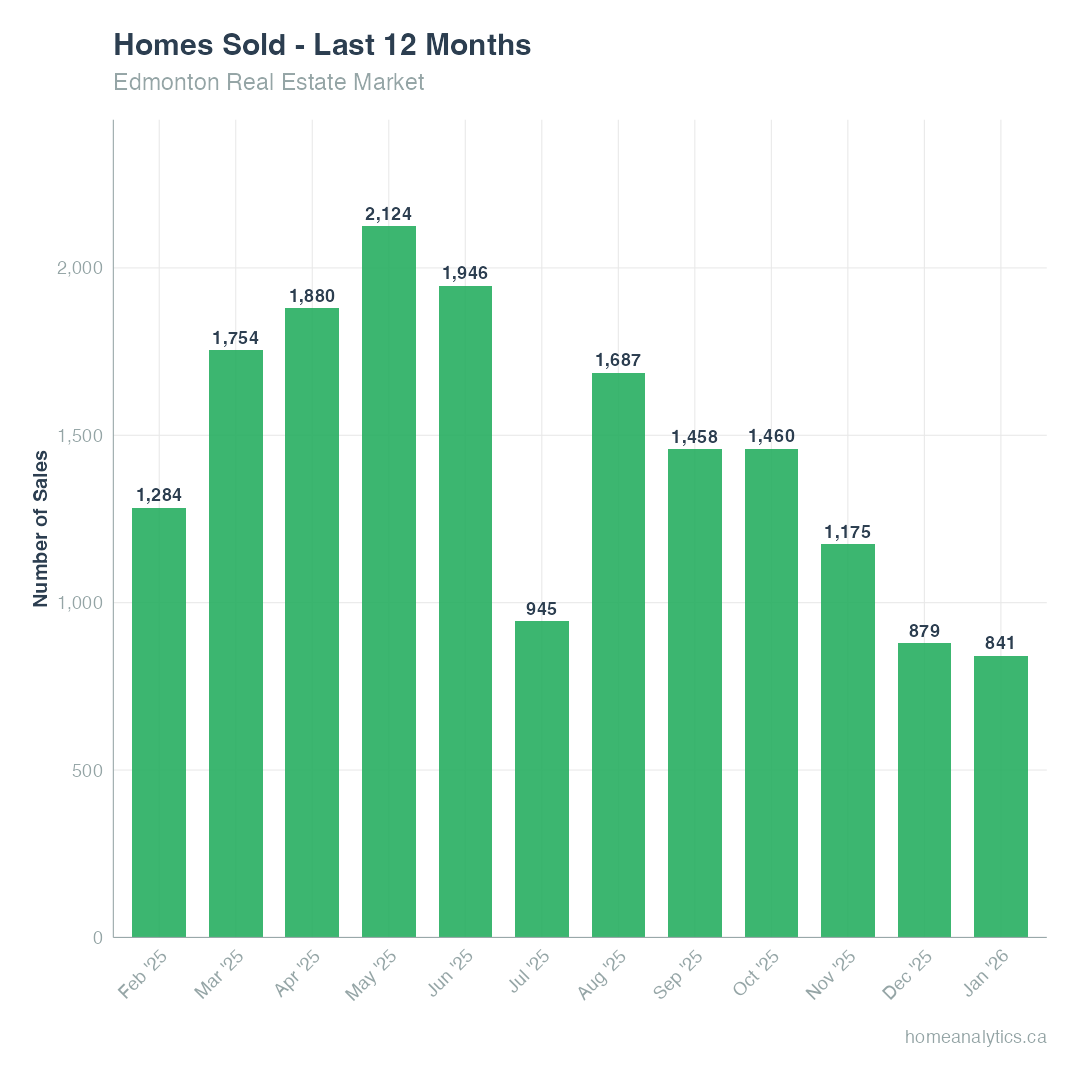
Sales Activity: 841 homes sold in January 2026, down 31.7% compared to January 2025. This marks a significant slowdown in transaction volume.
Pricing: The median home price sits at $396,500, down 2.5% from last year. Single-family detached homes are at $495,500, while condominiums increased to $193,000 (up 5.8% year-over-year).
Market Speed: Homes are spending a median of 52 days on the market. About 31% of properties are selling within 30 days, indicating selective buyer activity.
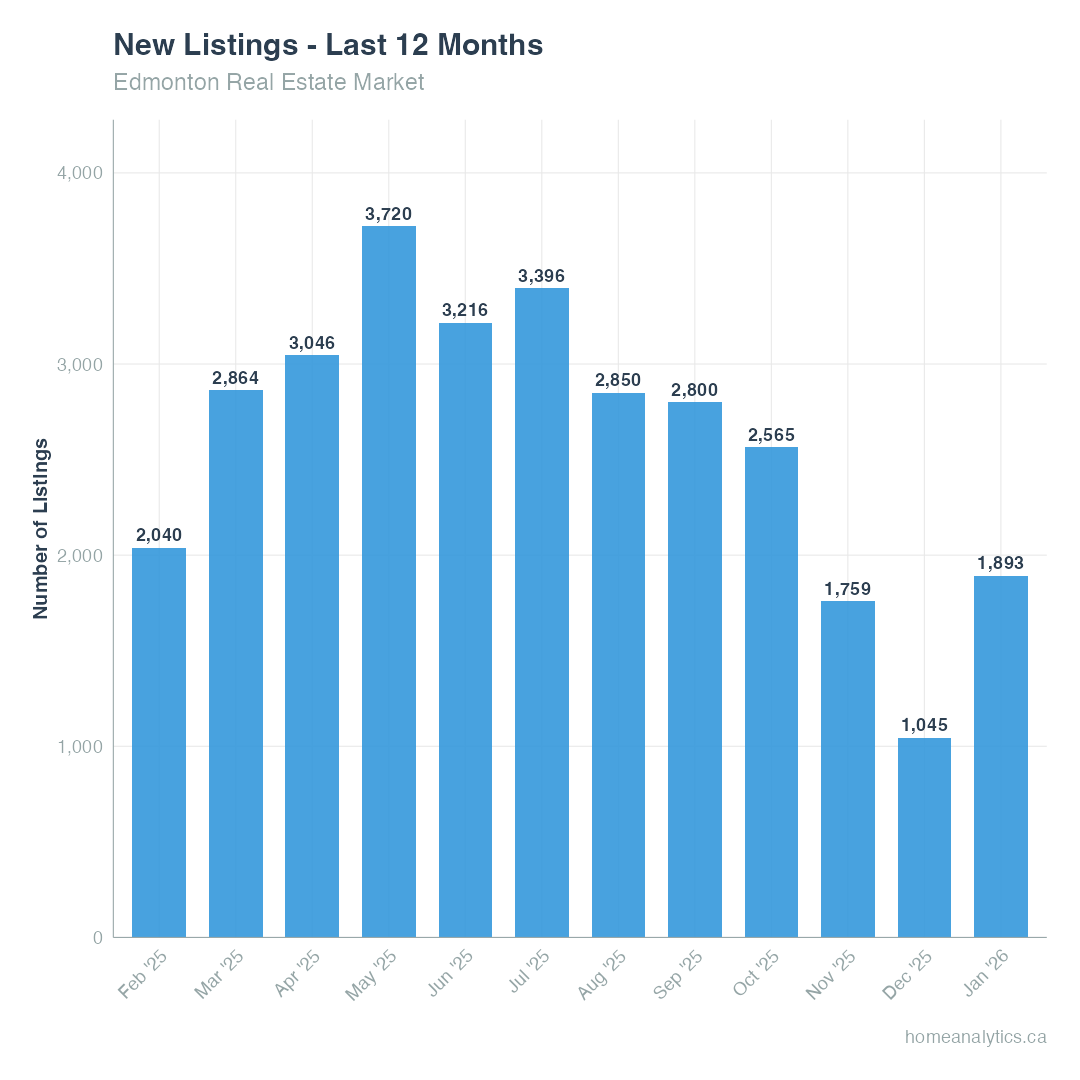
Inventory: New listings jumped 81% month-over-month to 1,893 properties. With 2.3 months of inventory supply, we're in balanced market territory where neither buyers nor sellers hold decisive leverage.
Market Temperature: Currently a balanced market with a 44% sales-to-new-listings ratio. However, only 10.1% of homes sold above asking price, and the median sale price came in at 98% of list price.
Sales Activity: Transaction Volume Drops Significantly
Home sales in Edmonton have fallen to their lowest level in nearly two years, underscoring the impact of mounting economic uncertainty and elevated borrowing costs.
In January, the total number of homes sold in Edmonton was 841, which was 31.7% lower than in January 2025. Month-over-month, sales declined 4.3% from December's 879 transactions.
New listings, however, surged 81.1% month-over-month to 1,893 properties as sellers entered the market in anticipation of spring activity.
The sales-to-new-listings ratio dropped to 44%, placing Edmonton firmly in balanced market conditions. This represents a significant shift from the seller's market dynamics that characterized much of 2024 and early 2025.
Pricing Trends: Modest Corrections Across Most Segments
The median price for all property types in Edmonton was $396,500 in January, down 2.5% from the same month last year.
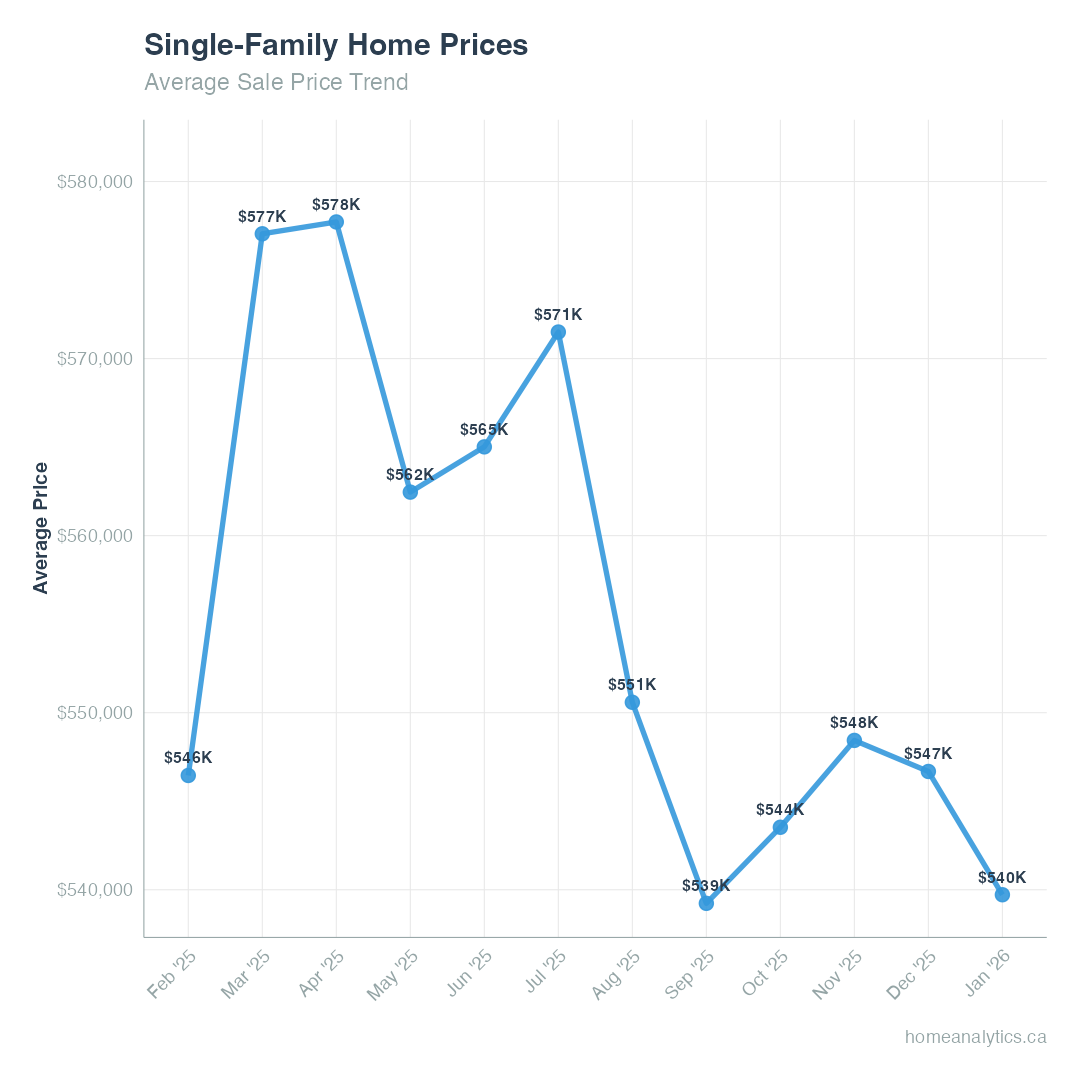
Last month's median single-family detached home price was $495,500, down 3.3% from the same month last year. The average price declined 3.7% year-over-year to $539,719.
Half-duplexes saw their median price drop to $411,000, a 4.1% year-over-year decrease, while the average price held relatively steady at $426,058 (down just 0.1% annually).
Condominiums bucked the downward trend, with median prices rising 5.8% year-over-year to $193,000. The average condo price increased 4.4% to $214,062, reflecting strong demand in the entry-level segment.
Townhouse median prices decreased 5.7% year-over-year to $266,000, with average prices down 1.8% to $275,196.
Price per square foot across all property types averaged $286, down 1.0% from last year, signaling modest home value adjustments rather than dramatic corrections.
Understanding Price by Property Size
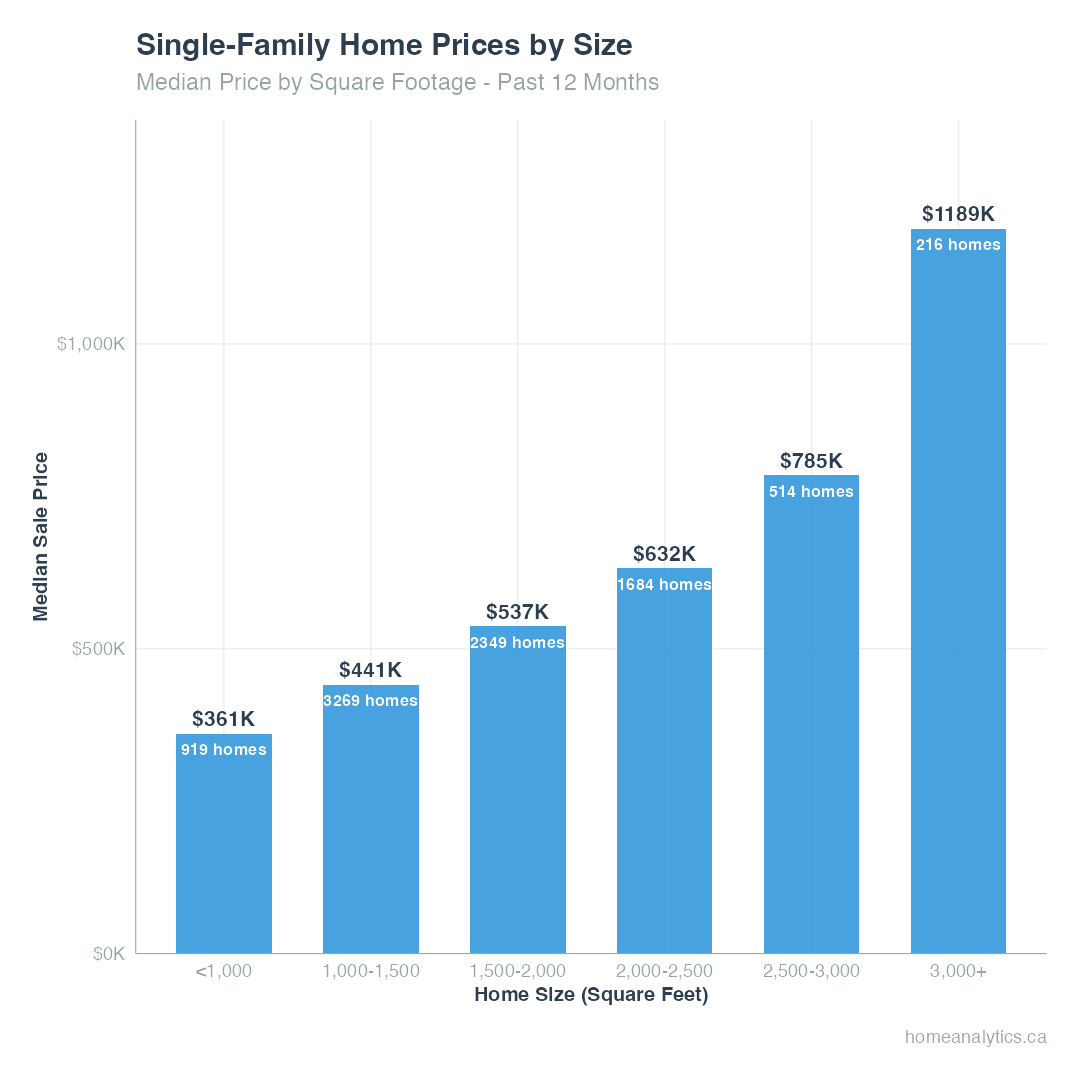
For single-family detached homes, the relationship between size and price remains strong:
Homes under 1,000 sq.ft. sold at a median of $361,000 (919 transactions)
The 1,000-1,500 sq.ft. range—the most active segment—saw 3,269 sales at a median of $441,000
Homes between 1,500-2,000 sq.ft. commanded $537,000 median (2,349 sales)
The 2,000-2,500 sq.ft. category reached $631,712 median (1,684 sales)
Premium homes over 3,000 sq.ft. sold for a median of $1,189,400 (216 transactions)
Price per square foot for single-family homes currently sits at $312, down 2.3% from the 12-month high of $336 recorded in April 2025.
Market Timing: When to Buy for Maximum Leverage
Analysis of 12 months of sale-to-list price data reveals strategic timing opportunities for buyers.
Properties listed for 9-12 weeks offer the highest discount potential, selling on average 2.6% below list price, with an 87.7% probability of below-list sales.
Fresh listings (Week 1) command premium prices, averaging 1.5% above list, as buyer competition peaks immediately after listing.
The data shows a consistent 4.7 percentage point decline in sale-to-list ratio from Week 1 to extended listings, giving patient buyers meaningful negotiating power.
Currently, 80% of homes are selling below list price, with only 12% selling above asking—a dramatic shift from the 38% selling over asking in February 2025.
Inventory Dynamics: Supply Growing Faster Than Demand
The number of homes available for sale at the end of January was up 2.7% over last year, while sales volume dropped 31.7%.
Active listings for condominiums have reached their highest level in three years.
New listings increased 81.1% month-over-month, allowing buyers to benefit from increased choice and greater negotiating power.
Days on Market: Properties Taking Longer to Sell
Homes spent a median of 52 days on the market in January, up from 50 days last year.

Single-family detached homes averaged 86 days before selling, while duplexes moved faster at 82 days. Condominiums took the longest at 108 days, followed by townhomes at 90 days.
This marks the ninth straight month of homes taking longer to sell on a year-over-year basis, with days on market up 21.7% compared to January 2025.
Only 31.3% of properties sold within 30 days, compared to 39% in early 2025, indicating buyers are exercising more caution and conducting thorough due diligence.
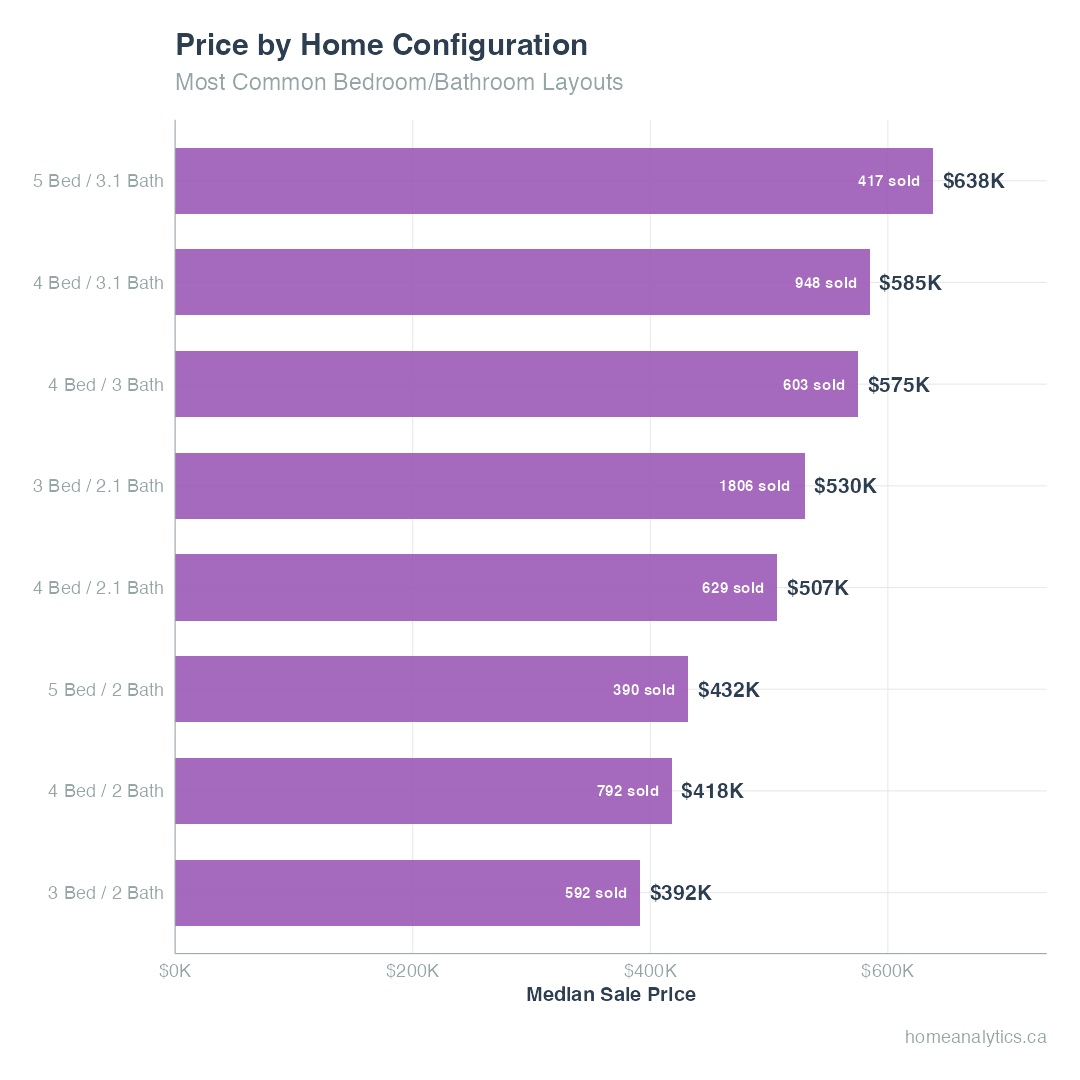
Bedroom and Bathroom Configurations: What Buyers Want
For single-family homes, the 3-bedroom/2.1-bathroom configuration dominated with 1,806 sales at a $530,000 median price and 44 days average market time.
The 4-bedroom/3.1-bathroom layout commanded $585,000 median (948 sales, 34 days average), while the more affordable 4-bedroom/2-bathroom option sold for $418,000 median (792 sales, 25 days average).
Five-bedroom homes with 3.1 bathrooms reached $638,085 median (417 sales), representing the premium family home segment.
The fastest-selling configuration was the 4-bedroom/2-bathroom layout at just 25 days average market time, suggesting strong demand for move-up family homes at accessible price points.
Neighborhood Spotlight: Strathcona
Strathcona delivered 123 transactions over the past 12 months at a median price of $291,555—29.7% below Edmonton's overall median.
The neighborhood is dominated by condominiums (67.5% of sales) and appeals primarily to buyers seeking urban convenience and walkability. Two-bedroom units represent 51.2% of sales at a $295,000 median.
Properties are selling in 29 days median, with 54% moving within 30 days—indicating a fast-paced market despite the lower price point.
However, prices decreased 27.1% over the past 12 months, from a $350,000 median in February 2025 to $255,000 in January 2026, reflecting a significant correction in the condo segment.
The most active price range is $100,000-$150,000 (17.1% of sales), followed closely by $150,000-$200,000 (16.3%), making Strathcona one of Edmonton's most accessible neighborhoods for first-time buyers.
Neighborhood Spotlight: Westmount
Westmount recorded 132 sales over 12 months at a $328,500 median price—20.8% below Edmonton's median but offering a diverse property mix.
Unlike Strathcona, Westmount shows a more balanced distribution: 52.3% condominiums and 39.4% single-family homes, appealing to a broader demographic.
Properties spent 35 days on market median, with 45% selling within 30 days—a moderate pace compared to Strathcona's faster movement.
Prices declined 68.3% from a $505,000 median in February 2025 to $160,000 in January 2026, though this dramatic shift reflects the neighborhood's wide price distribution rather than uniform depreciation.
Two-bedroom homes dominate at 33.1% of sales ($204,000 median), followed by 3-bedroom properties at 23.1% ($548,500 median), showing the neighborhood serves both entry-level and move-up buyers.
Market Conditions: What This Means for Buyers and Sellers
With costs of borrowing stabilizing and home prices declining modestly over the last twelve months, the market is currently benefiting buyers.
Sellers are facing longer listing times and increased competition from growing inventory, while buyers have more leverage than they've had in two years.
The share of homes selling for more than the owner's list price decreased to 10.1% in January, down from 38% in February 2025.
80% of listings are selling below asking price—the highest share for any January since at least 2023—giving buyers meaningful negotiating room.
Unless there is a material improvement in the broader economic outlook—particularly with greater clarity around interest rate policy and employment trends—this cautious tone is likely to continue through Q1 2026.
Looking Ahead: What to Expect in February and Beyond
While the current environment might feel a bit tough due to higher inventory levels and a more cautious buyer base, the city's long-term trajectory remains rooted in steady population growth and economic diversification.
Looking toward 2026, we are likely entering a phase of normalization, expect some pricing adjustments and longer marketing times—but Edmonton’s relative affordability compared to hubs like Toronto and Vancouver continues to make it one of the most resilient and attractive housing fundamentals in Canada.
Ready to make your move?
Use our net proceeds calculator to see what you'll walk away with when you sell, or explore the 2023 Edmonton zone map to find your next neighborhood.
For sellers: Check out our guide on the best time of year to sell a house in Alberta and learn how much it costs to sell your house in Alberta.
For buyers: Browse luxury condos for sale in Edmonton or explore St. Albert single-family homes.