.png)
The July numbers are in, and they tell a quieter story than the headlines from earlier this year. The Edmonton residential real estate market continues to evolve as we move into the back half of 2026, and this month's data points to a market catching its breath rather than changing direction.
In this recap, we'll cover recent sales and pricing trends, shifting buyer and seller dynamics, and the supply numbers shaping the road ahead. Market conditions are moving, driven by cooling sales volume, a steady pullback in new listings, and prices that are holding remarkably flat. While pricing adjustments are showing up unevenly across property types, Edmonton remains a fundamentally strong market with long-term growth potential.
Before the details, here are the questions most buyers and sellers are asking right now, with short answers up front.
Are Edmonton home prices going up?
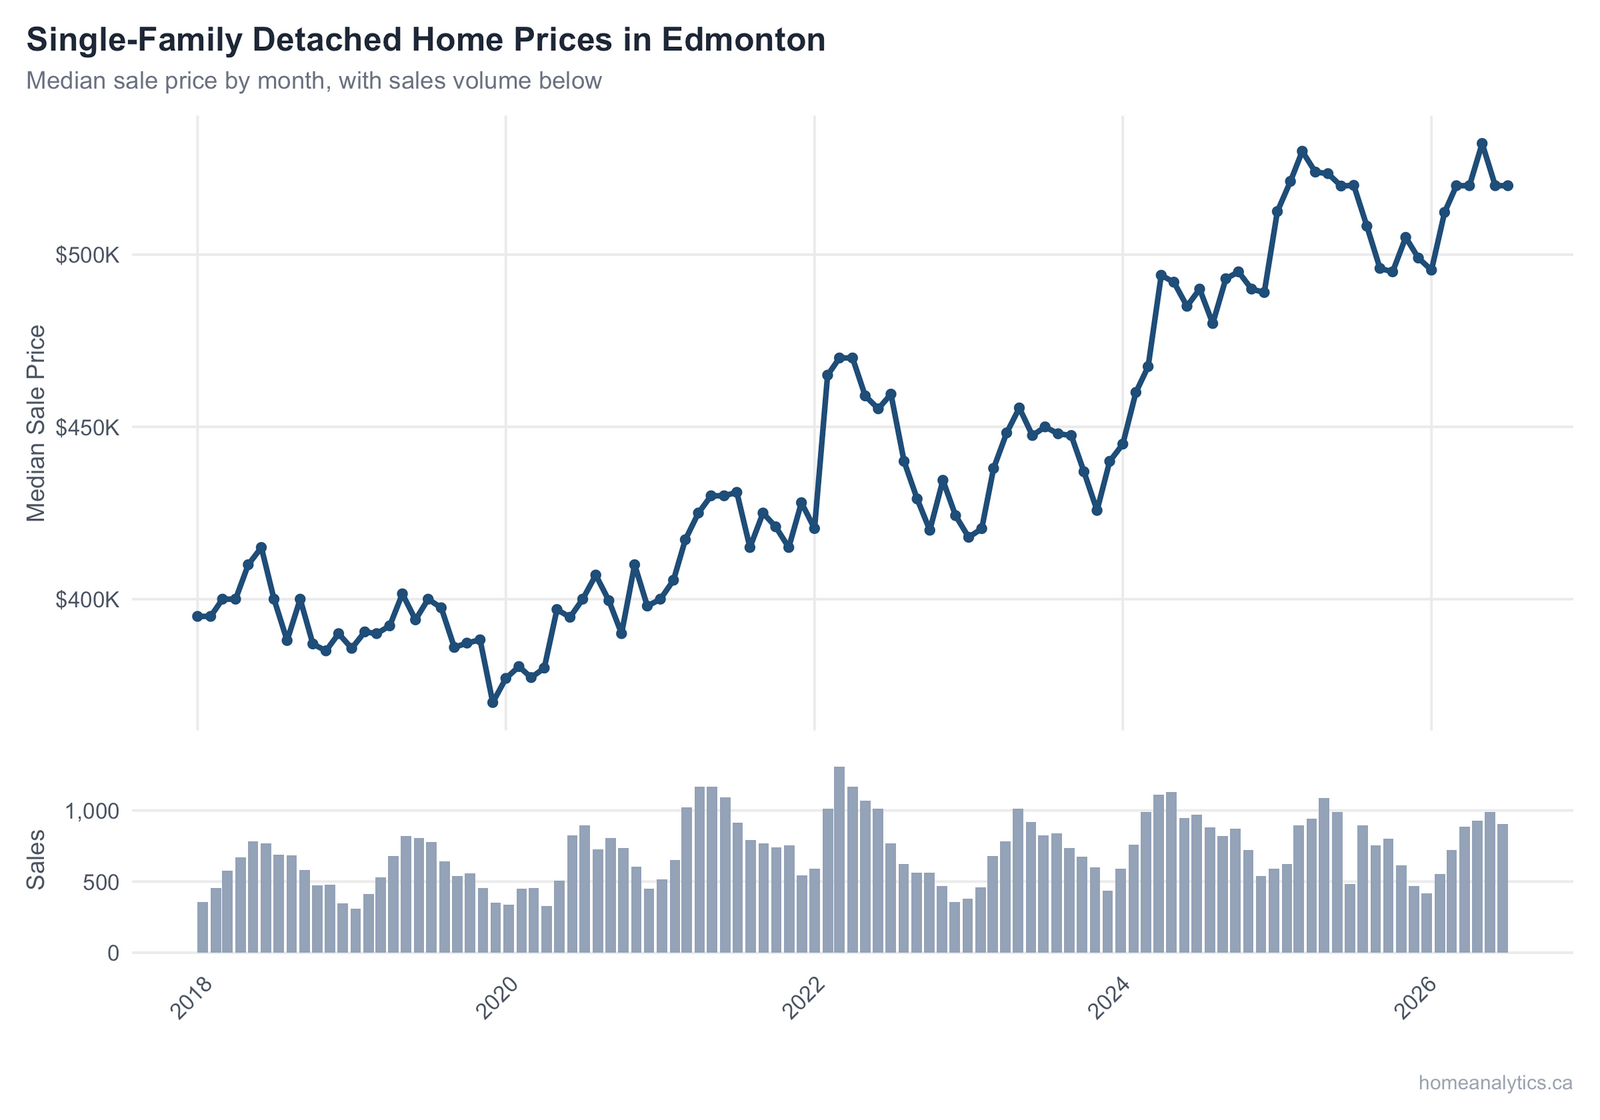
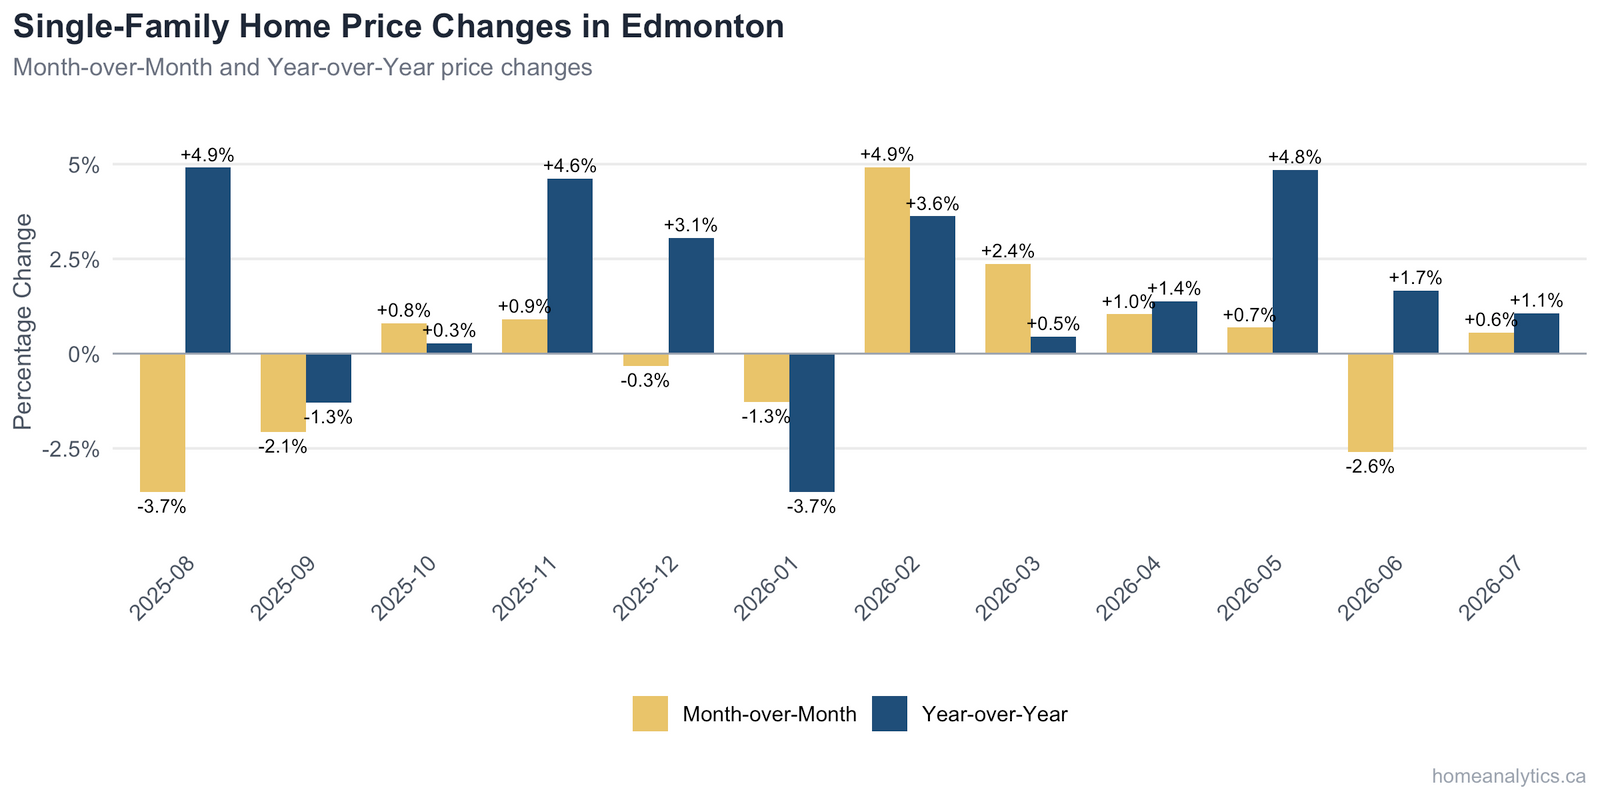
Mostly they're holding steady. The median price of a single-family detached home was $520,000 in July, unchanged month-over-month and essentially flat from a year ago. The average detached price ticked up 0.6% to $577,590. Condos gained ground, with the median up 2.1% to $192,000, while townhomes softened, with the median down 2.8% to $262,500. So the answer depends a lot on what you're buying.
Is now a good time to buy or sell in Edmonton?
It's close to a coin flip right now, which is unusual, and for a lot of people that's good news. The sales-to-new-listing ratio sat at 0.53 in July, squarely in balanced-market territory, meaning buyers and sellers have roughly equal footing. Homes sold at a median of 98% of list price, so sellers are still getting close to what they ask, while buyers have more room to negotiate than they did a year ago.
Are homes sitting on the market longer?
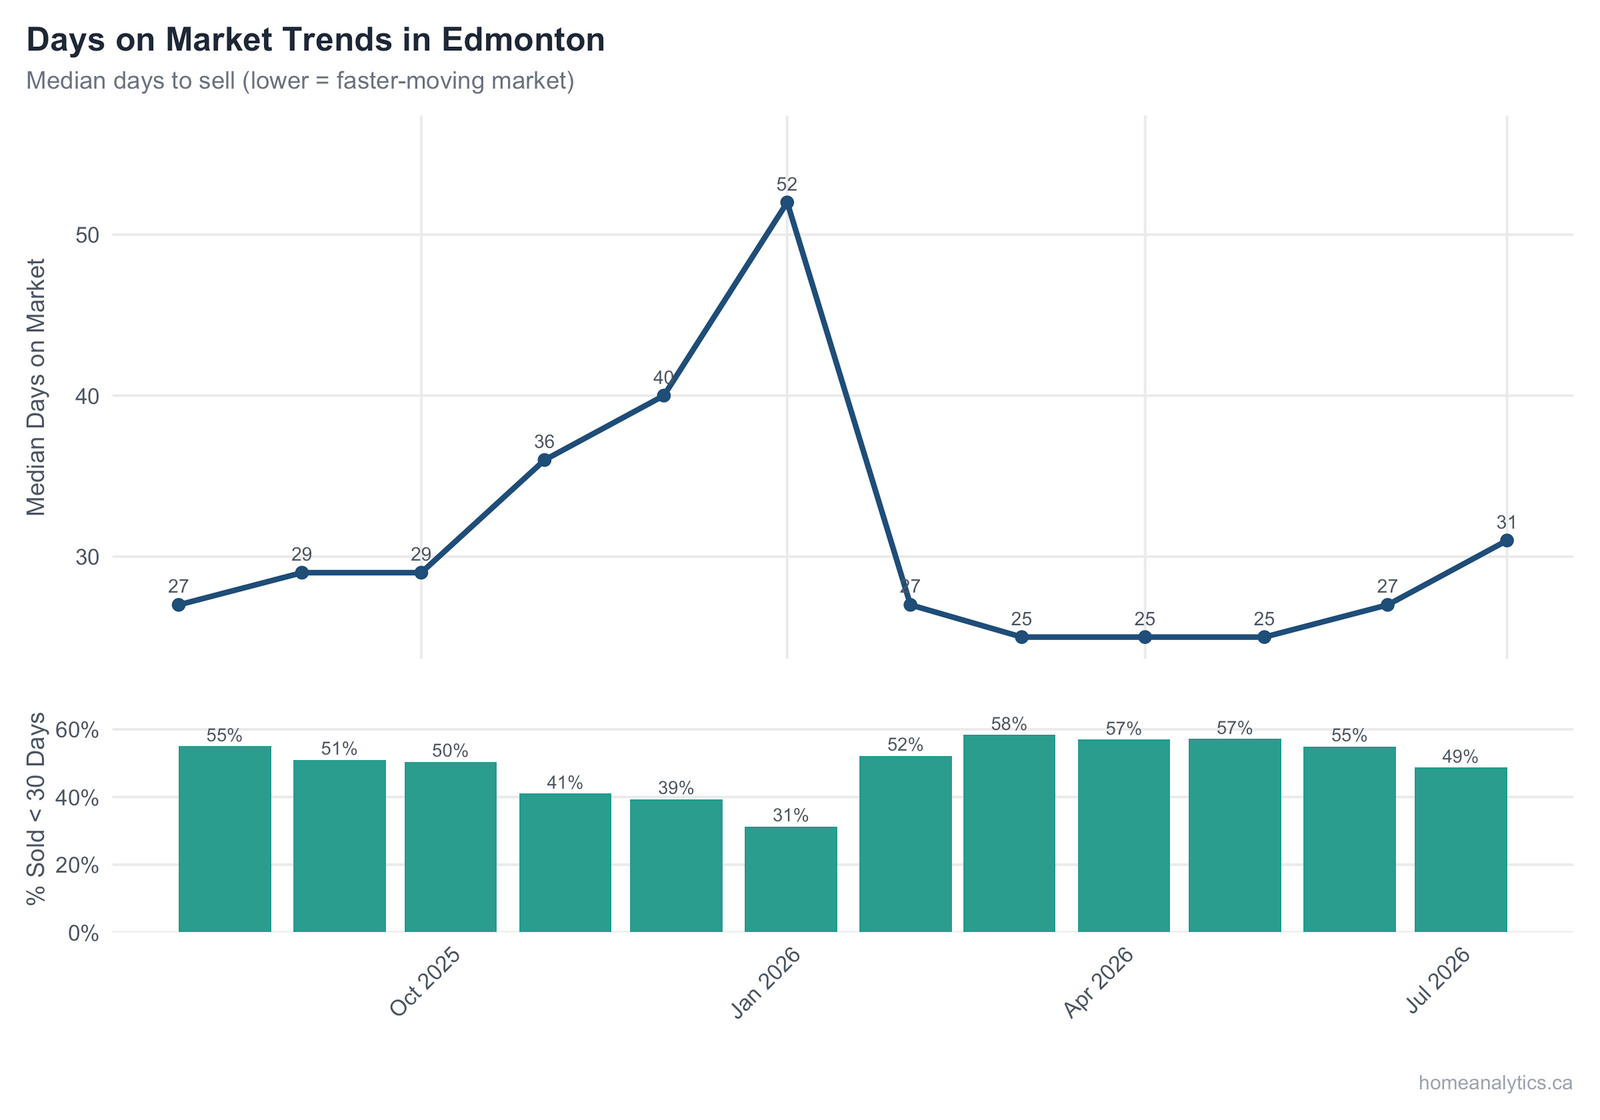
A little longer, yes. The typical Edmonton home sold in a median of 31 days in the most recent month, and nearly half (48.7%) sold in under 30 days. Year-over-year, though, the average time to sell has stretched from 34 to 42 days across the first seven months of 2026. Patience is worth more now than it was last summer.
Sales Activity: Cooler, But Not Cold
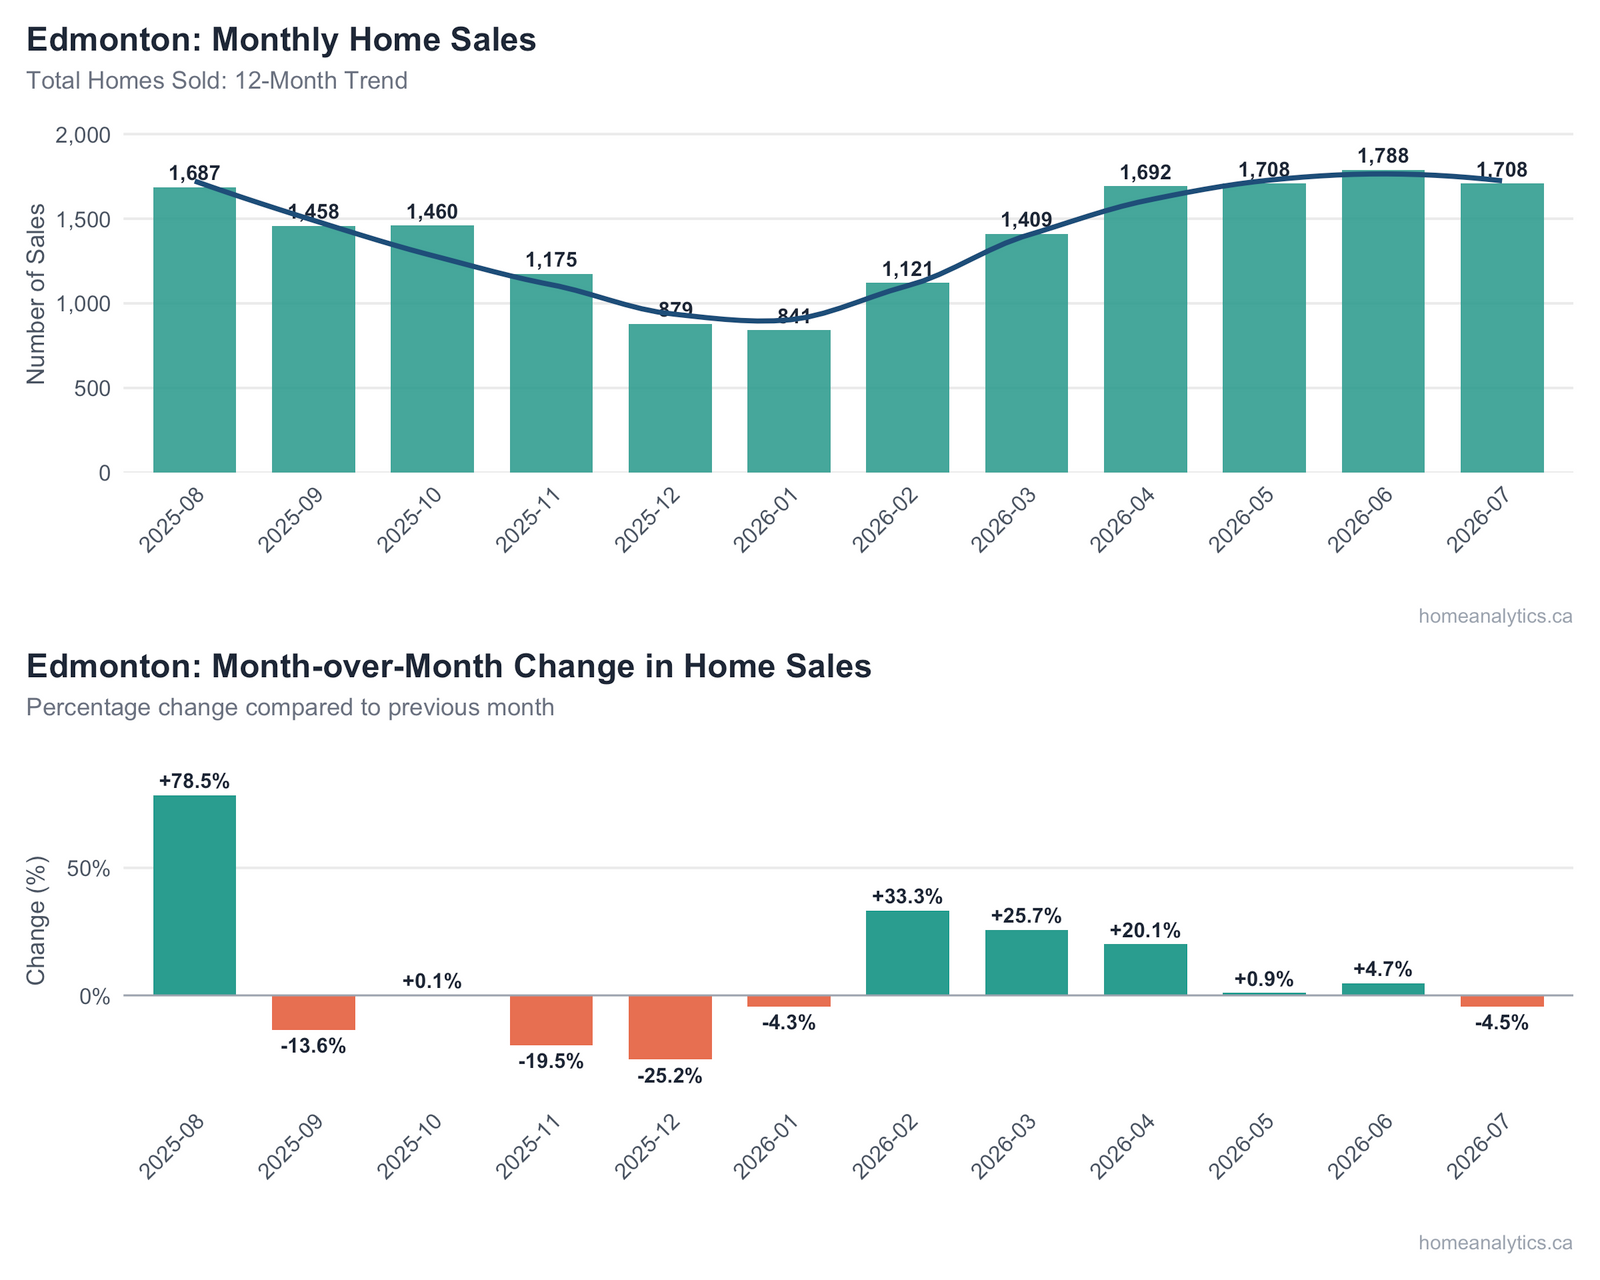
Sales pulled back again in July. The total number of homes sold in Edmonton was 1,708, which was 4.5% lower than in June. New listings eased in step, so the whole market looks like it downshifted for the summer instead of buyers walking away.
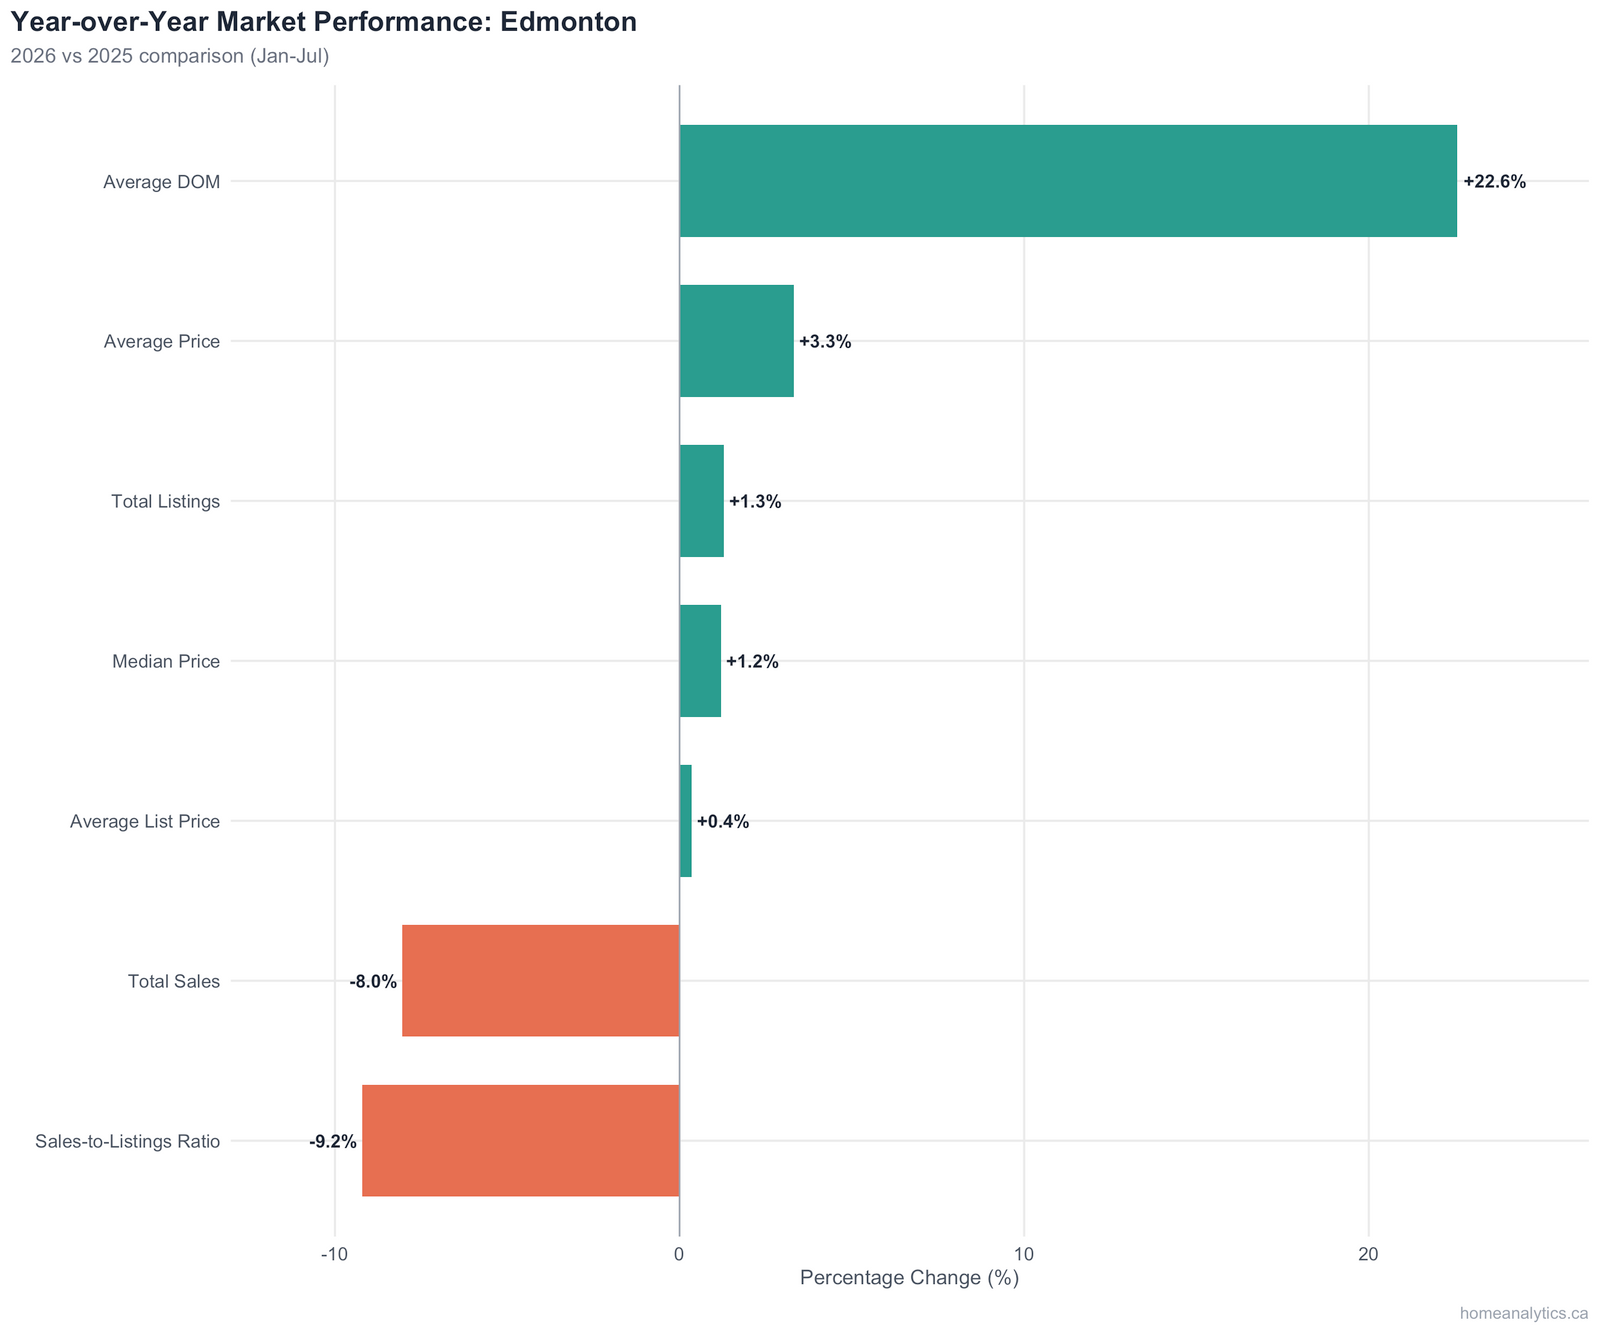
The year-over-year figure needs a footnote. On paper, July sales were up 80.7% from the same month last year. But that reflects an unusually low base in July 2025. The steadier gauge is the year-to-date total: 10,267 homes have sold through the first seven months of 2026, down 8.0% from the 11,165 sold over the same stretch of 2025.
So the honest read is a market running about 8% slower than last year, with one noisy monthly comparison layered on top.
Prices: Flat at the Top, Mixed Underneath
Here's the story in one line: the middle of the market barely moved, but the edges did. The median price of a single-family detached home was $520,000 in July, unchanged month-over-month and flat year-over-year. Underneath that steadiness, the property types went their own ways.
Condos were the quiet winner, with the median up 2.1% for the month and 2.0% over the year. Townhomes were the soft spot, down 2.8% for the month and 6.2% over the year. On a per-square-foot basis, detached homes sold for about $323/sq.ft in July, down 1.7% over the past twelve months, a small dip that shows value holding steady.
Where does the money actually change hands? The most common sale price in Edmonton is under $300,000, which accounts for 28% of all transactions. Homes between $400,000 and $750,000 make up 47.3% of the market, while luxury properties over $1 million represent just 2.6% of sales.
Inventory: Supply Is Quietly Building
New listings in Edmonton for July were 3,228, a decline of 3.9% from the previous month. The number of homes available for sale continues to edge up over last year, with total listings through July up 1.3% compared with the same period in 2025.
For buyers, more listings means more choice and a bit more leverage. It's a leading indicator worth watching, since it tends to show up in the data before it becomes obvious in day-to-day negotiations.
Days on Market: A Longer Wait Than Last Summer
Homes are taking a bit longer to sell than they were a year ago. In July, the typical Edmonton home spent a median of 31 days on the market, and 48.7% of homes sold in under 30 days. Single-family detached homes moved fastest, at a median of 27 days.
Broken out by property type, cumulative days on market looked like this:
The year-over-year trend is the clearer signal. Across the first seven months of 2026, the average time to sell stretched from 34 days to 42 days, an increase of 22.6%. Condos and townhomes felt it most, so if you're selling an attached home, plan for a longer runway than last year.
Who Has the Upper Hand: Buyers or Sellers?
This is where Edmonton gets interesting, because the signals don't all point the same way, and that's worth understanding instead of glossing over.
The sales-to-new-listing ratio of 0.53 places Edmonton in balanced-market territory, where buyers and sellers hold roughly equal negotiating power. The market has, in fact, been characterized as balanced for most of 2026.
For sellers, the takeaway is encouraging but not a green light for wishful pricing. Homes sold at a median of 98% of list price, and 14.2% sold above list. Among detached homes specifically, 19% sold over list, while 75% sold below it. Pricing right still matters more than pricing high.
What This Means If You're Buying
You have more room to work with than buyers did a year ago, and the data points to a few concrete plays.
Time is on your side. Fresh listings command a premium. In their first week on the market, homes sold for an average of 1.1% above list. Listings that have sat for 26 or more weeks sold for an average of 3.4% below list, and 85.6% of them sold below asking. Patience can be worth real money, though it's smart to ask why a home has lingered before you assume it's a bargain.
Run the full cost, not just the price. Closing costs add up. The Alberta land transfer fee calculator will give you a realistic picture before you write an offer.
Shop by zone. Prices and pace vary a lot across the city. The Edmonton zone map and the full map search are the fastest way to compare northwest, southwest, and southeast neighborhoods side by side.
What This Means If You're Selling
Sellers are still in a decent position, but the market rewards precision over optimism.
Price at market value from day one. The premium for fresh listings is real, and it fades. There's roughly a 4.6-percentage-point decline in the sale-to-list ratio between a home's first week and its later weeks. Your best pricing window is the moment you go live, not three price cuts later.
Mind the calendar. Historically, May is the most active month for Edmonton sales and December the slowest. If timing is flexible, that matters. Here's a data-based look at the best time of year to sell in Alberta.
Know your bottom line. Before you list, it helps to see what you'd actually walk away with. The net proceeds calculator and this breakdown of what it costs to sell a house in Alberta will give you clear numbers.
For Investors
The most balanced segment is also the most affordable one. Condos and apartments carried a six-month sales ratio of 0.46, the coolest and most negotiable part of the market, even as condo prices ticked up 2.0% year-over-year. That combination of softer competition and firming prices is worth a look for anyone focused on cash flow and entry cost. Luxury condos sit at the other end for buyers chasing amenity and location.
On the detached side, new construction carries a premium of $148,500 over homes 30 years and older, a 33.8% gap. But new builds also offer the best value per square foot in the market, at roughly $300/sq.ft. If your model favors appreciation and low near-term maintenance, that's the trade-off to weigh.
Neighborhoods Worth Watching
Priciest: Keswick led on median sale price at $539,000.
Busiest: Wîhkwêntôwin recorded the highest sales volume, with 224 transactions over the past six months, and also offered the lowest price per square foot at $211/sq.ft, a rare pairing of activity and value.
Fastest-moving: Homes in South Terwillegar sold the quickest, at a median of just 20.5 days on market.
If you're weighing where to buy or sell, the top-performing neighborhoods breakdown is a useful companion to this update.
The Bigger Economic Picture
Zoom out and the supply side of the story gets more context. Total housing starts in Alberta for June were 4,372, down 10.4% from the prior month, and total construction value in the province for May was about $1.55 billion, down 3.7% month-over-month. Fewer starts today can mean tighter new-home supply down the road, which is one more reason Edmonton's inventory picture is worth tracking closely.
Affordability and borrowing costs remain the backdrop to nearly every buying and selling decision this year. With prices holding flat and the cost of borrowing still front of mind for most households, many are timing their moves carefully instead of rushing. Given the balance in the market, that patience is being rewarded on both sides of the table.
What's Ahead
Despite the short-term headwinds of slower sales and a longer wait to close, Edmonton's residential market is well-positioned for long-term growth. While 2026 is shaping up to be a year of normalization, Edmonton's economic resilience and steady population growth continue to make it one of the stronger housing markets in Western Canada.
Want Numbers Specific to Your Home or Search?
Citywide medians are a starting point, not an answer. If you'd like a custom home valuation or a market breakdown for your exact neighborhood, price range, or property type, reach out and I'll put the data together for you. No pressure, just a clear picture to work from.